TLP

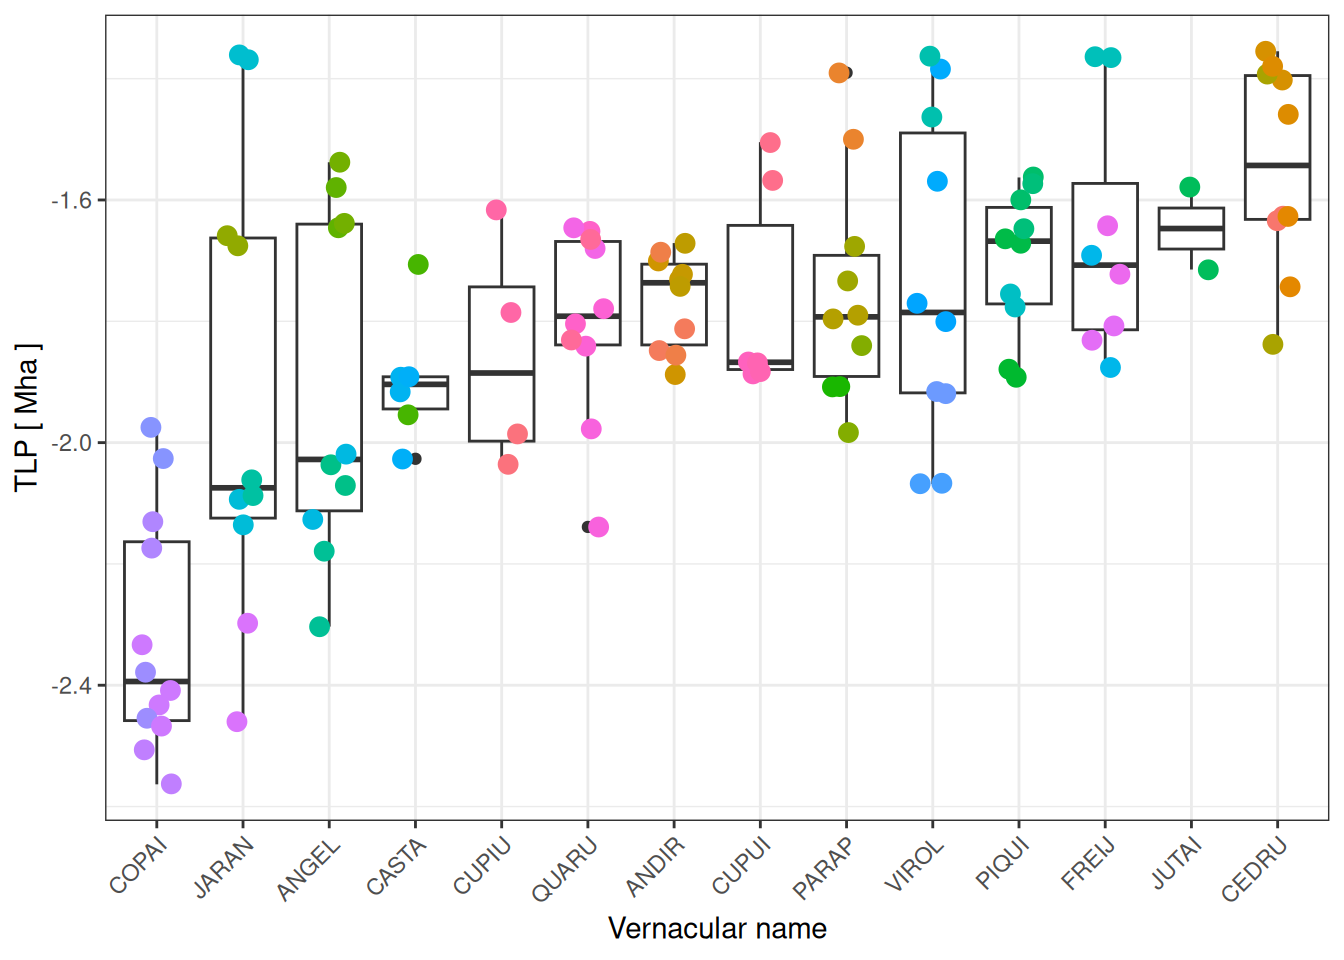
We extract the minimum osmometer measurement across the 10 measurement of one cycle per sample. We then compute \(\pi_0=\frac{-2.5}{100 \times osmo}\) using Van’t Hoff equation. Finally we computed TLP as \(\pi_{TLP} = 0.0832 \times \pi_0 - 0.631\) following Bartlett et al. (2012).

Code
lapply(1:5, function(i) 
  read_xlsx("data/raw/osmo/FEF25_TLP-12072025.xlsx", sheet = i)) %>% 
  bind_rows() %>% 
  rowwise() %>%
  mutate(osmo = min(c_across(MES1:MES10), na.rm = TRUE)) %>%
  ungroup() %>% 
  select (1:3, osmo) %>% 
  mutate(pio = -2.5/1000 * osmo) %>%
  mutate(tlp = 0.832 * pio - 0.631) %>% 
  rename(vernacular = Especies, tree = Idtree, leaf = Idleaf) %>% 
  select(-osmo, -pio) %>% 
  write_tsv("data/derived/tlp_raw.tsv")
Code
read_tsv("data/derived/tlp_raw.tsv") %>% 
  group_by(vernacular) %>% 
  mutate(tlp_s = mean(tlp)) %>% 
  ungroup() %>% 
  mutate(vernacular = fct_reorder(vernacular, tlp_s)) %>% 
  ggplot(aes(vernacular,
             tlp)) +
  geom_boxplot() +
  geom_jitter(aes(col = as.factor(tree)),
              width = 0.2, size = 3) + 
  theme_bw() +
  labs(x = "Vernacular name", y = "TLP [ Mha ]") +
  theme(axis.text.x = element_text(angle = 45, hjust = 1),
        legend.position = "none")