We first use the following bash code to aggregate images and convert pdf to png.
cd data/derived/
mkdir pdfs
ls ../raw/scans/*/*
cp ../raw/scans/*/* pdfs
mkdirs pngs
for file in $(ls pdfs/)
do
  pdftoppm pdfs/$file pngs/$file -png
done
We then use ImageJ (https://imagej.net/ij/download.html ) with the following steps:
Open virtual stack
Type > 8-Bit
Adjust > Threshold > Automatic
Analyze Particles
Size: 1000-Infinity
Circularity: 0-1
Display results, clear results, exclude on edges, summarize, composite ROIs
with or without include holes depending on the question
The intermediate threshold images with detected are saved for manual check.
Code
<- read_csv ("data/derived/area_excluded_summary.csv" ) %>% select (Slice, ` Total Area ` ) %>% rename (slice = Slice, area_excluded = ` Total Area ` ) %>% separate (slice, c ("vernacular" , "tree" , "leaf" )) %>% mutate (area_excluded = area_excluded / (1275 * 1755 ) * (21 * 29.7 ))<- read_csv ("data/derived/area_included_summary.csv" ) %>% select (Slice, ` Total Area ` ) %>% rename (slice = Slice, area_included = ` Total Area ` ) %>% separate (slice, c ("vernacular" , "tree" , "leaf" )) %>% mutate (area_included = area_included / (1275 * 1755 ) * (21 * 29.7 ))%>% left_join (la_in) %>% write_tsv ("data/derived/la.tsv" )
Code
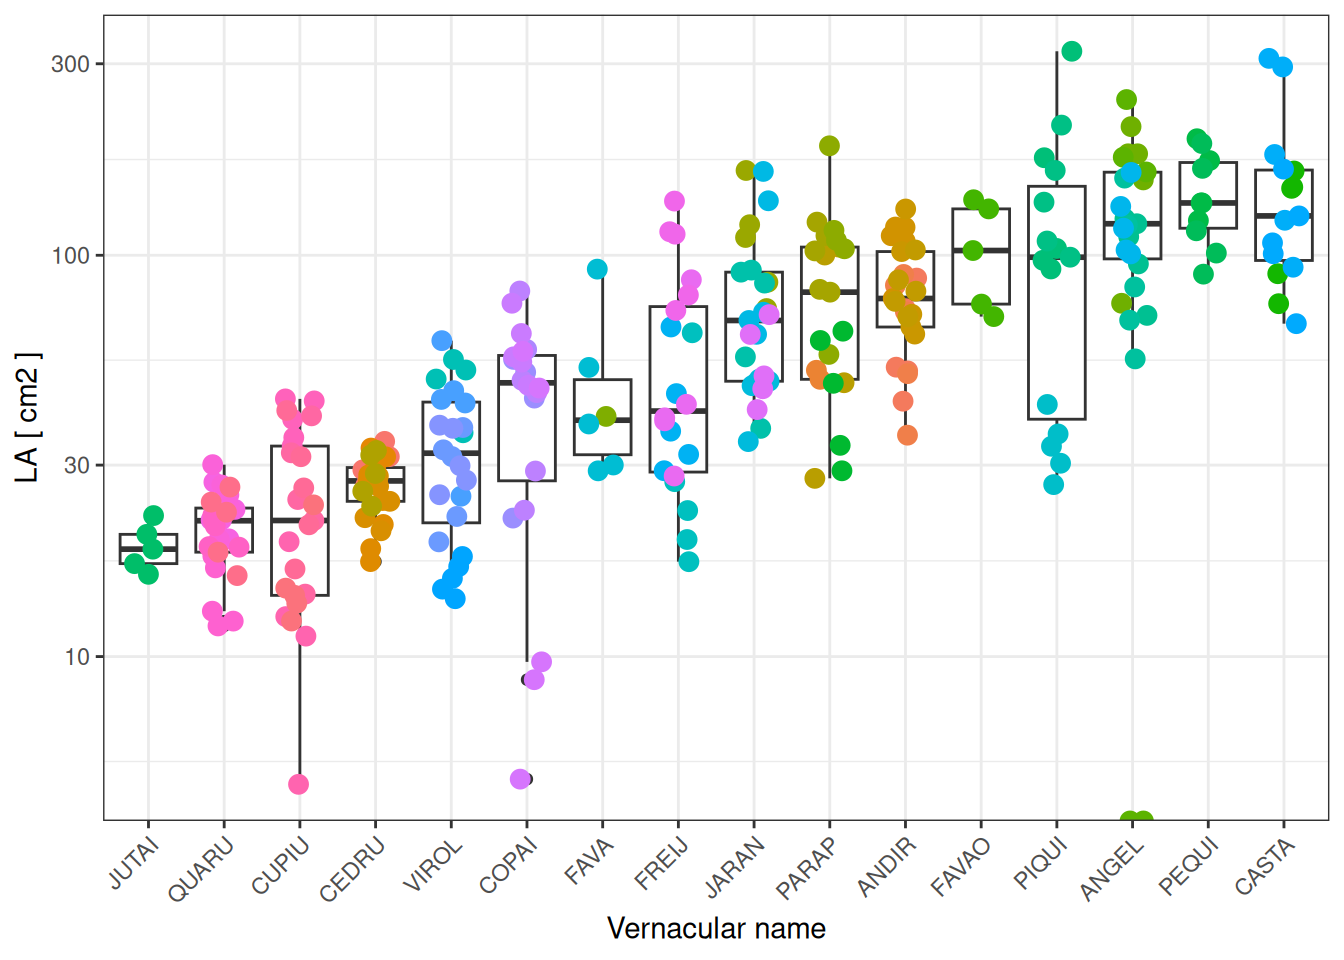
read_tsv ("data/derived/la.tsv" ) %>% group_by (vernacular) %>% mutate (la_s = mean (area_included)) %>% ungroup () %>% mutate (vernacular = fct_reorder (vernacular, la_s)) %>% ggplot (aes (vernacular,+ geom_boxplot () + geom_jitter (aes (col = as.factor (tree)),width = 0.2 , size = 3 ) + theme_bw () + labs (x = "Vernacular name" , y = "LA [ cm2 ]" ) + theme (axis.text.x = element_text (angle = 45 , hjust = 1 ),legend.position = "none" ) + scale_y_log10 ()