Chapter 4 Traits variation
Subsequent analysis aimed to assess variations in leaf traits among species, individuals, leaves and measurements.
4.1 Methods
4.1.1 Variance partitionning
Variance partitioning was obtained using linear mixed models for every trait and each pairs of levels studied. We aim to understand how much of the leaf trait variation is due to :
- measurement error,
- within-tree leaf variation,
- leaf sample repetitions among trees,
- intra- and inter-specific variation.
example for intra- and inter-specific variation: We estimated the among-species variance in our trait of interest from the comparison of the observed variance within and between species. In this case, Tree and Species are considered random effects but tree is nested in species.
model <- lme(trait~1, random = ~1|Species/Tree, data)
4.1.2 Coefficient of variation (CV)
Coefficient of variation (CV) is defined as the standard deviation divided by the mean and expressed as a percentage. It does not require any ad hoc assumptions. It is unitless and therefore convenient to compare variation of traits among species.
According to Yang et al. (2020), the best ITV estimator is CV1 when N >100.
\[CV1=\frac{sd(traits)}{mean(traits)}\]
For non-normal distribution of raw data or even after a logarithm transformation, CV4, or Bao’s estimator, is preferred:
\[CV4=CV1-(\frac{CV1^3}{N}-\frac{CV1}{4N}-\frac{CV1^2\times\gamma_1}{2N}-\frac{CV1\times\gamma_2}{8N})\]
Where gamma is Pearson’s measure of skewness and kurtosis of the trait sample distribution.
Log-transformation places less weight on the extreme large values resulting in a more robust estimation of ITV. It also reduced the skewness of the data, which makes it easier to handle.
We will calculate CV4 using the CV package.
For each trait, we described the magnitude of intraspecific variation by calculating coefficients of variation (CV) across each species.
The log-transformation reduces the proportional bias of ITV (Yang et al. 2020). CV only makes sense only on positive data, so we take the \(abs(P_{TLP})\).
Beware: CV was sometimes calculated for n<10 samples for some trait per species!
4.2 Results
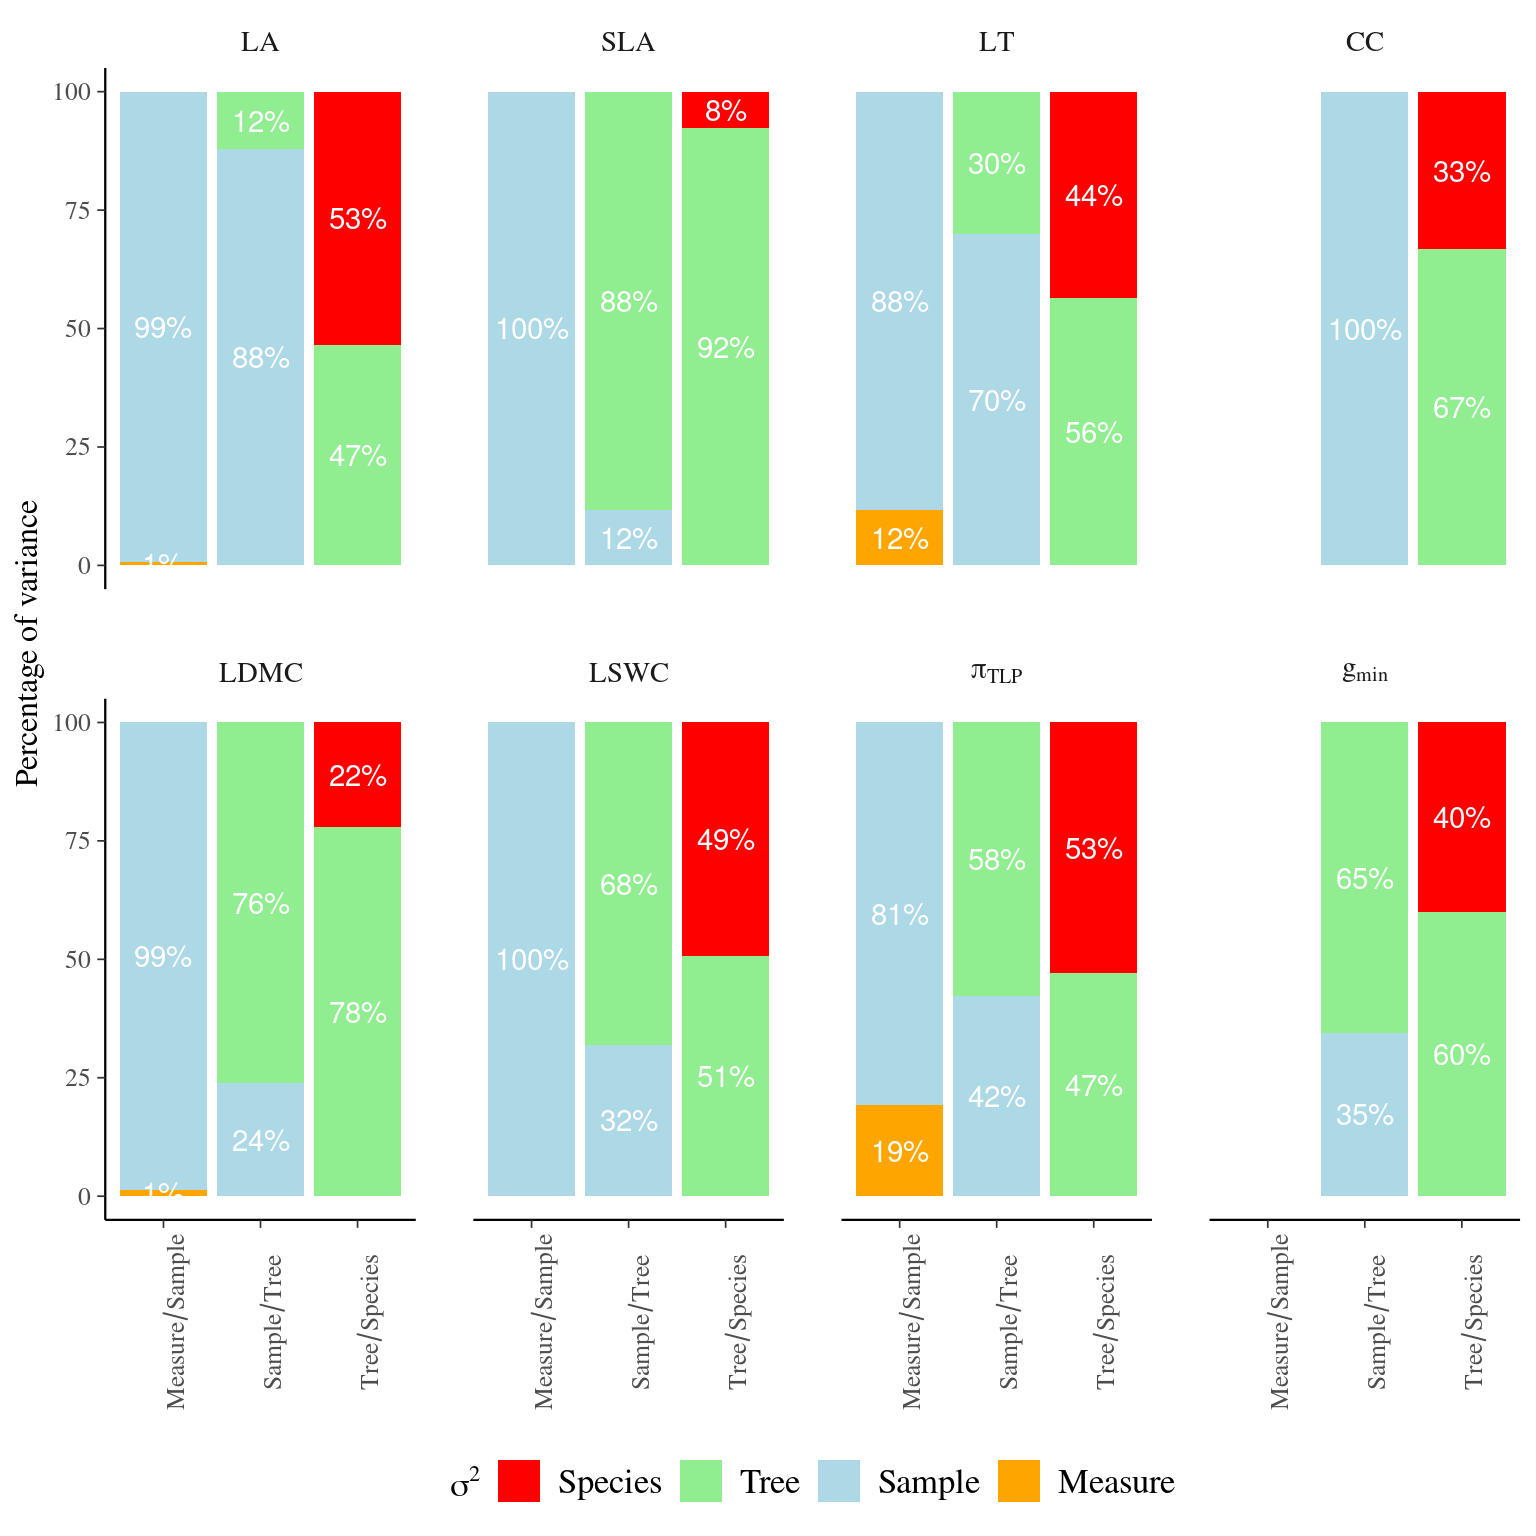
Figure 4.1: Variance partitioning of leaf traits across study levels. Variance partitioning was obtained using linear mixed models for every trait and each pairs of levels studied: measurement error, i.e. measurement repetitions among leave samples, within-tree leaf variation, i.e. leaf sample repetitions among trees, and intra- and inter-specific variation, i.e. individual repetitions among species. Leaf traits include specific leaf area (SLA), leaf dry matter content (LDMC), leaf fresh thickness (LT), leaf area (LA) leaf chlorophyll content (CC), leaf saturated water content (LSWC), leaf water potential at which leaf cells lose turgor (\(\pi_{TLP}\)), and leaf minimum conductance (\(g_{min}\)).
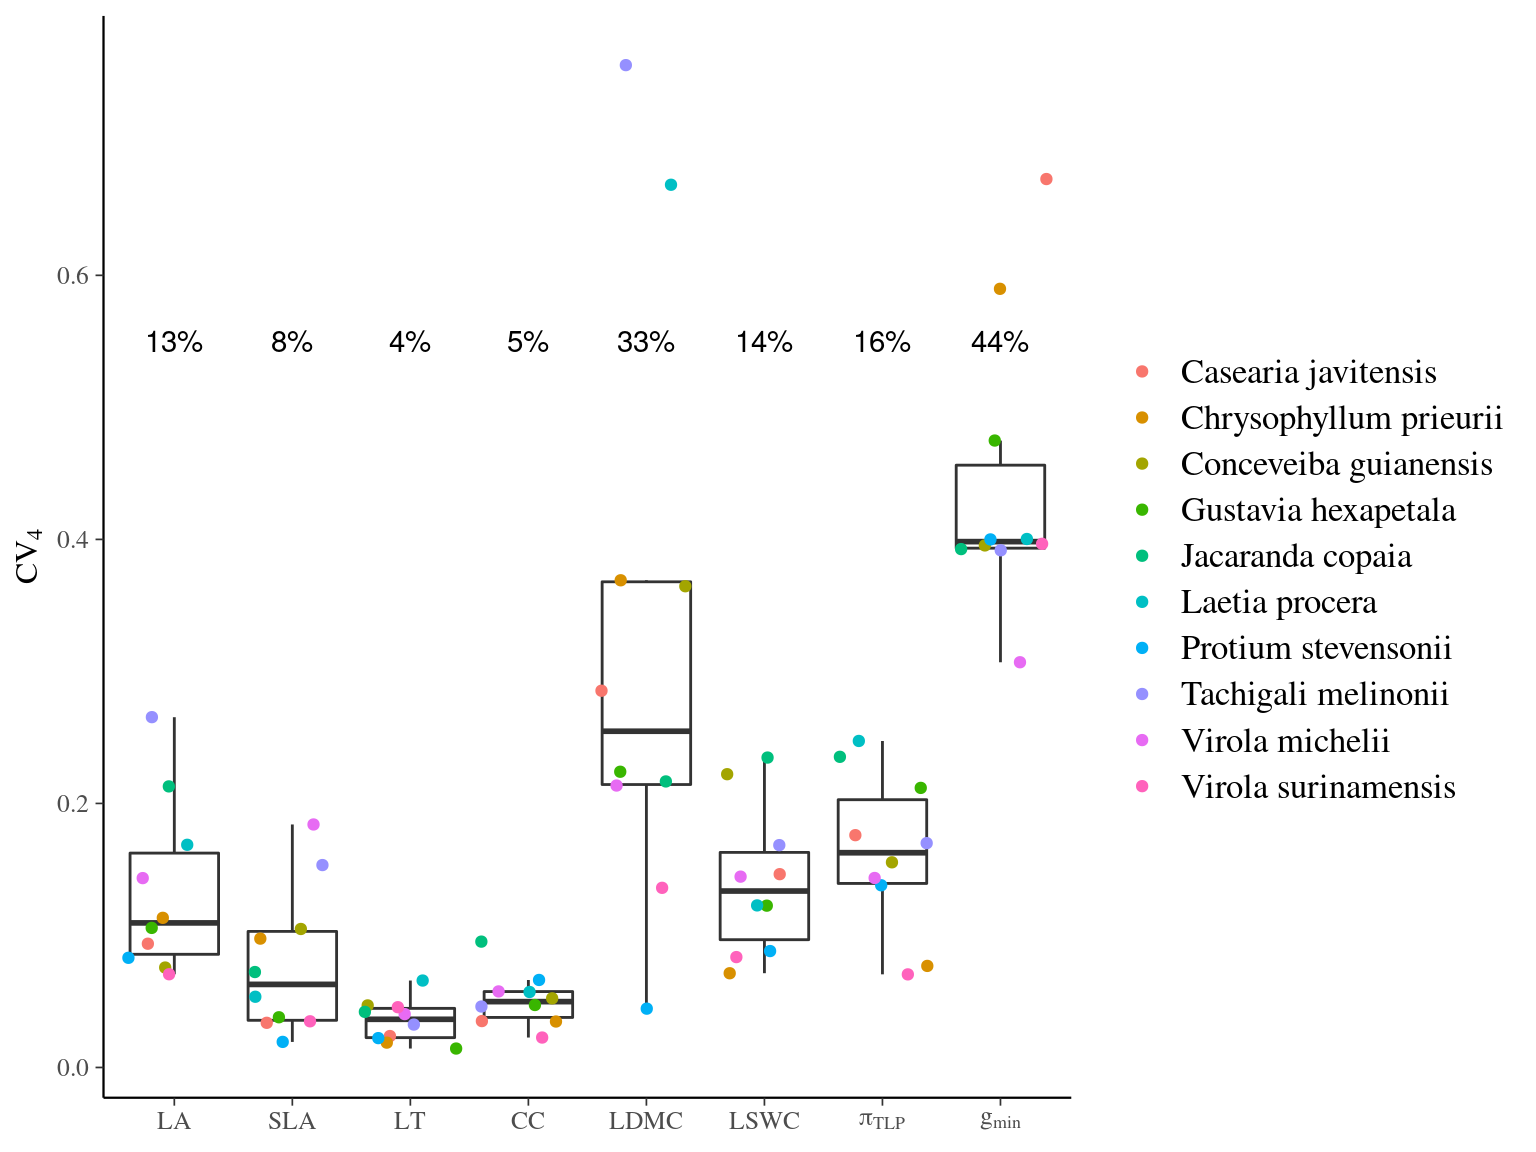
Figure 4.2: Intraspecific coefficient of variation for leaf traits across species. Coefficient of variation used was \(CV_4\). Leaf traits include specific leaf area (SLA), leaf dry matter content (LDMC), leaf fresh thickness (LT), leaf area (LA) leaf chlorophyll content (CC), leaf saturated water content (LSWC), leaf water potential at which leaf cells lose turgor (\(\pi_{TLP}\)), and leaf minimum conductance (\(g_{min}\)). Dashed grey line shows the mean across species with the value given in black as a percentage.
Sylvain:
- Leaf traits show moderate non-negligible CV within species (8-16%) except high for \(g_{min}\) and LDMC (resp. 39% and 33%) and low for LT (4%), with strong variation among species for LDMC (from 4% with P stevensonii to 76% with T. melonii).
- Leaf traits show strong interspecific variation (40-63%), except for SLA and LDMC (resp. 9% and 24%), but also strong intraspecific variation for all traits (30-91%)
- Leaf trait intraspecific variation is mostly due to the individual tree (55-88%) except for a strong variability across samples within tree for LA and CC (resp. 79% and 100%)
- Leaf trait intra-sample variation is almost only due to sample (82-100%) except for a non-negligible measure error within sample for LT and \(\pi_{TLP}\) (resp. 9% and 14%)
- Coefficient of variation and variance partitioning thus provide complementary information, with for instance high individual variation with SLA (91%) due to species weak variability (9%) more than intraspecific variability (CV=8%) (=>see SI boxplots)
- Results can drive sampling, e.g. \(\pi_{TLP}\) ii a better candidate than \(g_{min}\) at the interspecific level with both strong species variability (55%) and a low coefficient of intraspecific variation (16%)
- All together results indicate non-negligible intraspecific trait variation, including hydraulic traits, questioning sampling methodology and determinants of this variation unexplained by measurement error or within individual variation across samples
Marion:
All traits exhibited considerable intraspecific variation, with CVs ranging from approximately 4–39% (Fig. 4.2). LT, CC and SLA exhibited low variation at 4 %, 5% and 8 % respectively. LA, \(P_{tlp}\), LSWC had intermediate variation, from 13-16 %. LDMC and \(g_{min}\)) varied with the highest CVs ≥ 30 %.
We have two species with composed leaves: Tachgali melinonii and Jacarando copaia. Throughout all the traits, these two species expressed high (sometimes the highest) CV, meaning the highest dispersion of individuals, highest ITV for these species. We must be careful with this interpretation as we measured the leaflets and not the leaves. But leaflets may be more plastic than leaves.
we must be aware of estimation biais: CV4 may overestimate ITV when the distribution of raw or log-transformed trait data is close to the normal distribution (???).
4.3 Discussion
CV allows us to compare the distribution of trait values when those are expressed in different units. The higher the CV is, the higher the dispersion of the individual values around the mean. CV offers a way to directly compare variation among species with different abundances (Helsen et al. 2017). Studies have shown a positive relationship between species ITV and niche breadth (Clark 2010) species with larger ITV tend to have larger geographical ranges than species with smaller ITV (Brown 1984).
4.4 SIs
4.4.1 CV table
| SpeciesLong | LA | SLA | LT | CC | LDMC | LSWC | Ptlp | gmin |
|---|---|---|---|---|---|---|---|---|
| Casearia javitensis | 0.094 | 0.034 | 0.024 | 0.035 | 0.285 | 0.146 | 0.176 | 0.673 |
| Chrysophyllum prieurii | 0.113 | 0.098 | 0.019 | 0.035 | 0.369 | 0.071 | 0.077 | 0.590 |
| Conceveiba guianensis | 0.076 | 0.105 | 0.047 | 0.052 | 0.364 | 0.222 | 0.155 | 0.395 |
| Gustavia hexapetala | 0.106 | 0.038 | 0.014 | 0.047 | 0.224 | 0.123 | 0.212 | 0.475 |
| Jacaranda copaia | 0.213 | 0.072 | 0.042 | 0.095 | 0.217 | 0.235 | 0.235 | 0.393 |
| Laetia procera | 0.169 | 0.054 | 0.066 | 0.057 | 0.669 | 0.123 | 0.247 | 0.400 |
| Protium stevensonii | 0.083 | 0.019 | 0.022 | 0.066 | 0.045 | 0.088 | 0.138 | 0.400 |
| Tachigali melinonii | 0.265 | 0.153 | 0.033 | 0.046 | 0.759 | 0.168 | 0.170 | 0.392 |
| Virola michelii | 0.143 | 0.184 | 0.040 | 0.058 | 0.214 | 0.145 | 0.144 | 0.307 |
| Virola surinamensis | 0.071 | 0.035 | 0.046 | 0.023 | 0.136 | 0.084 | 0.071 | 0.397 |
| mean | 0.133 | 0.079 | 0.035 | 0.051 | 0.328 | 0.140 | 0.162 | 0.442 |
4.4.2 Individual variation
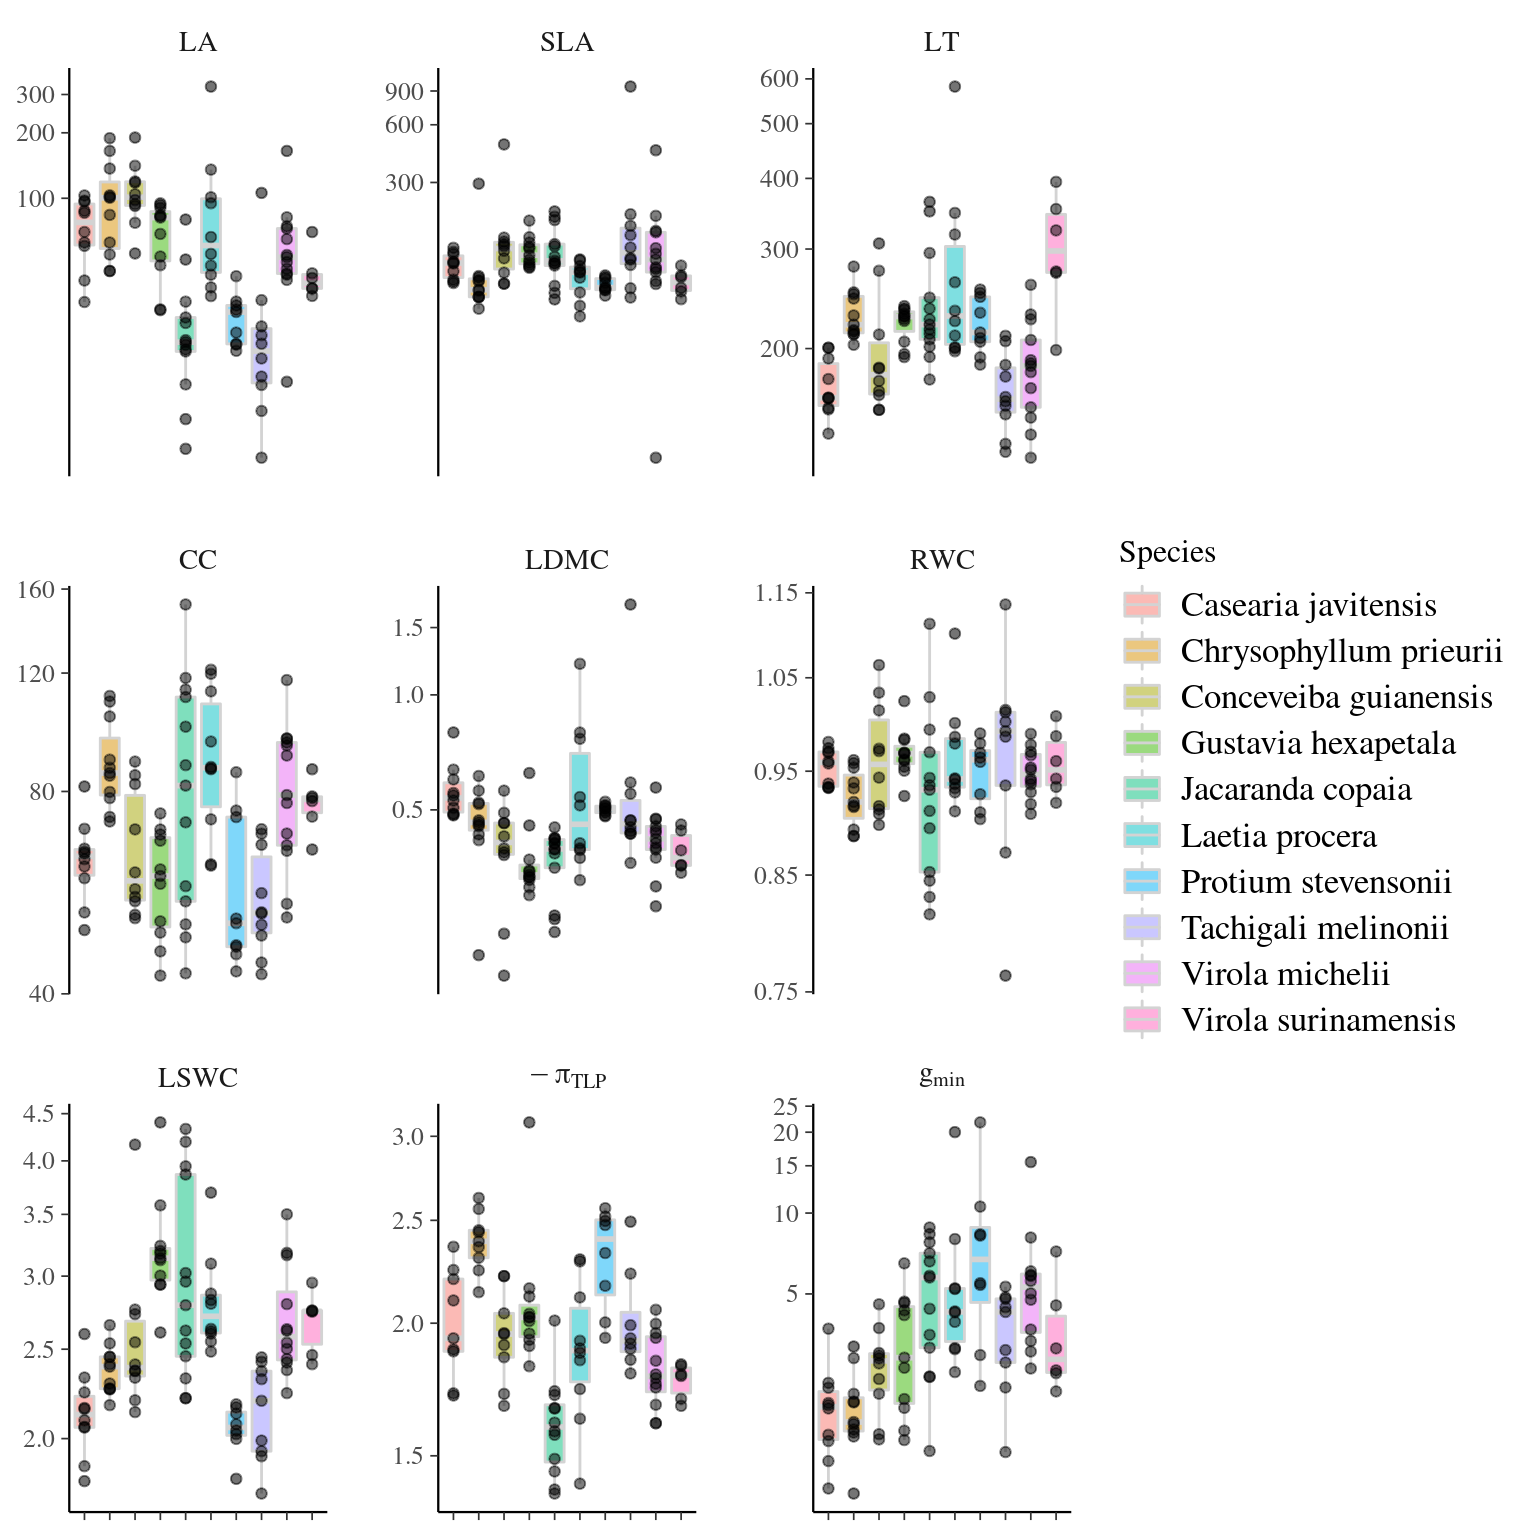
Figure 4.3: Traits distributions when testing for individual variation.
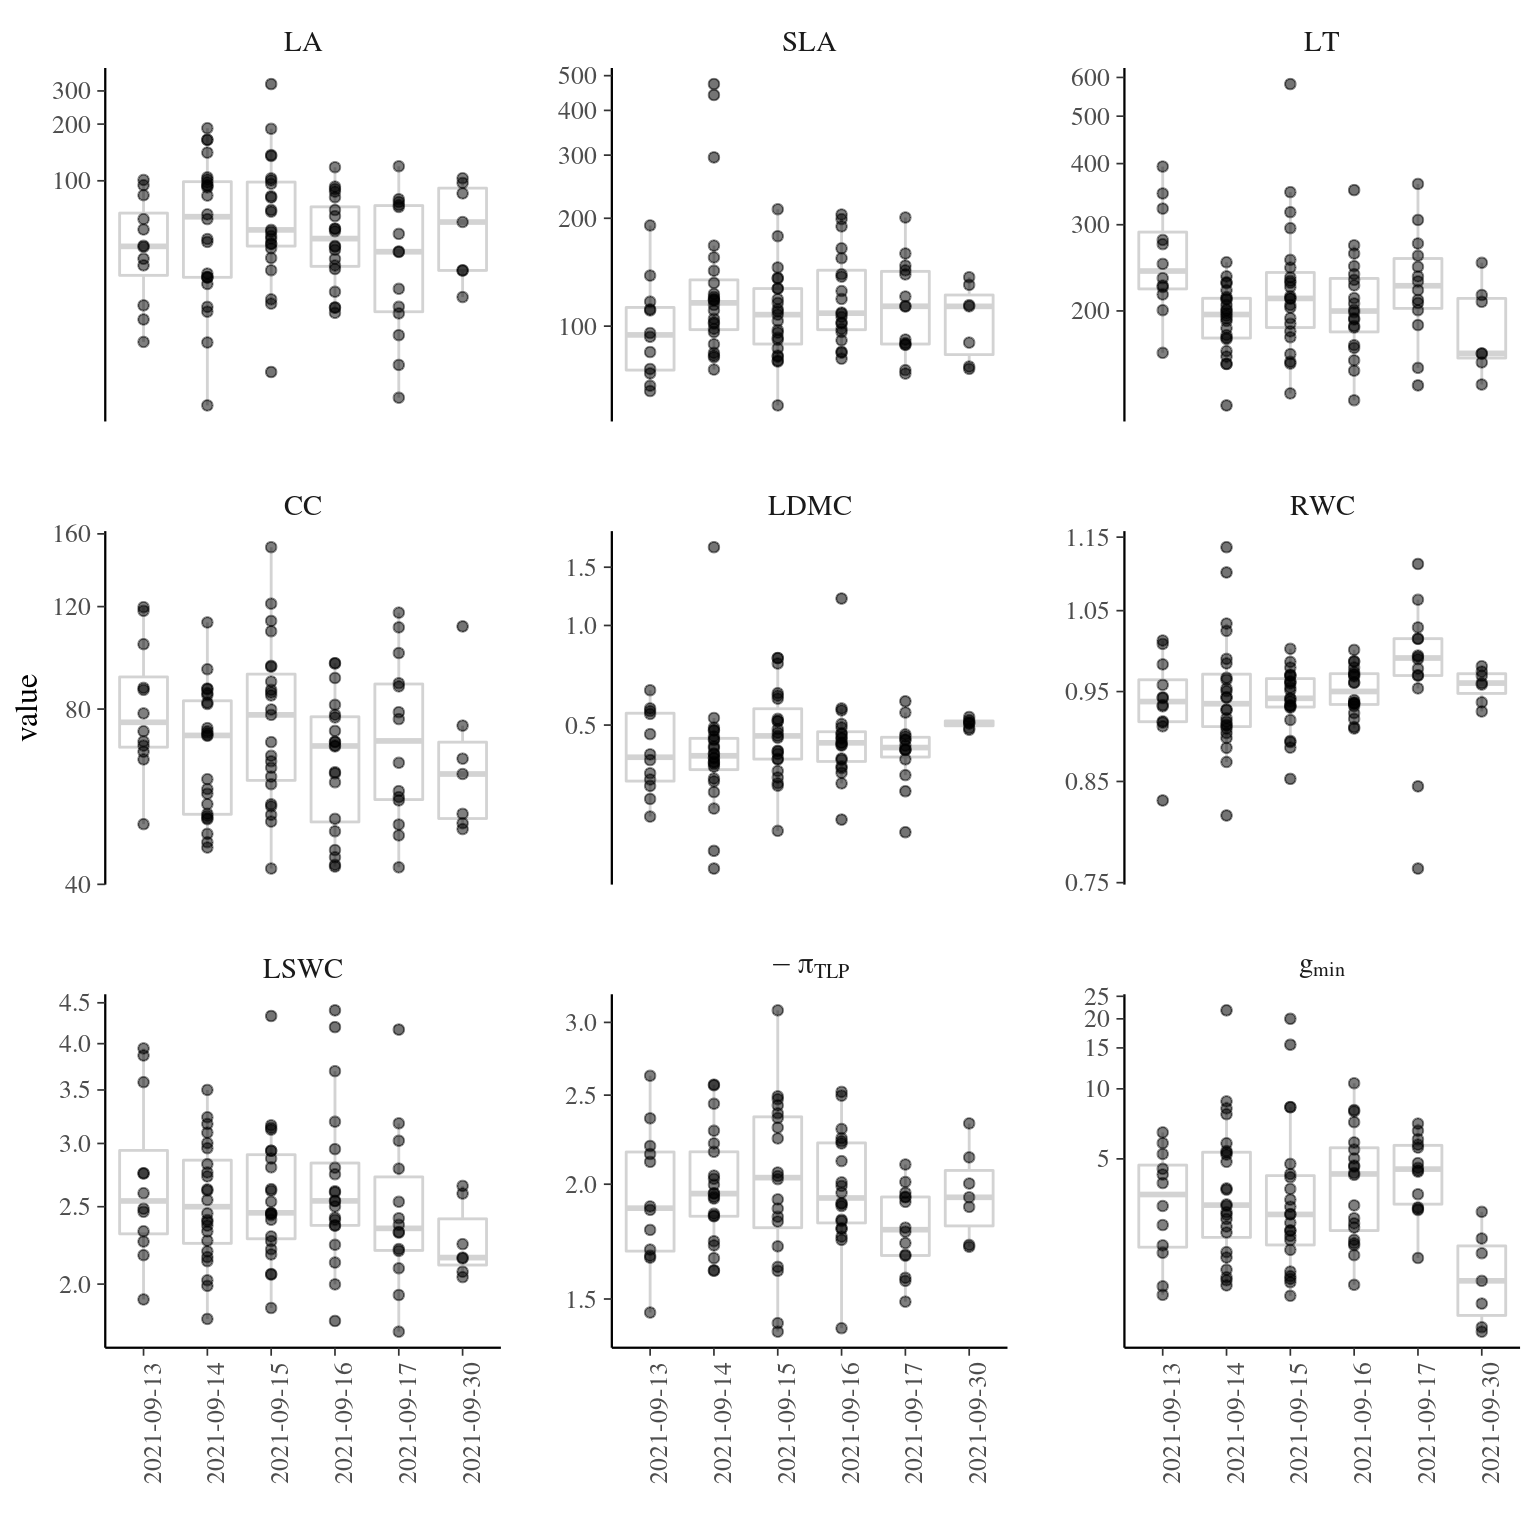
Figure 4.4: Traits distributions when testing for individual variation and sampling date.
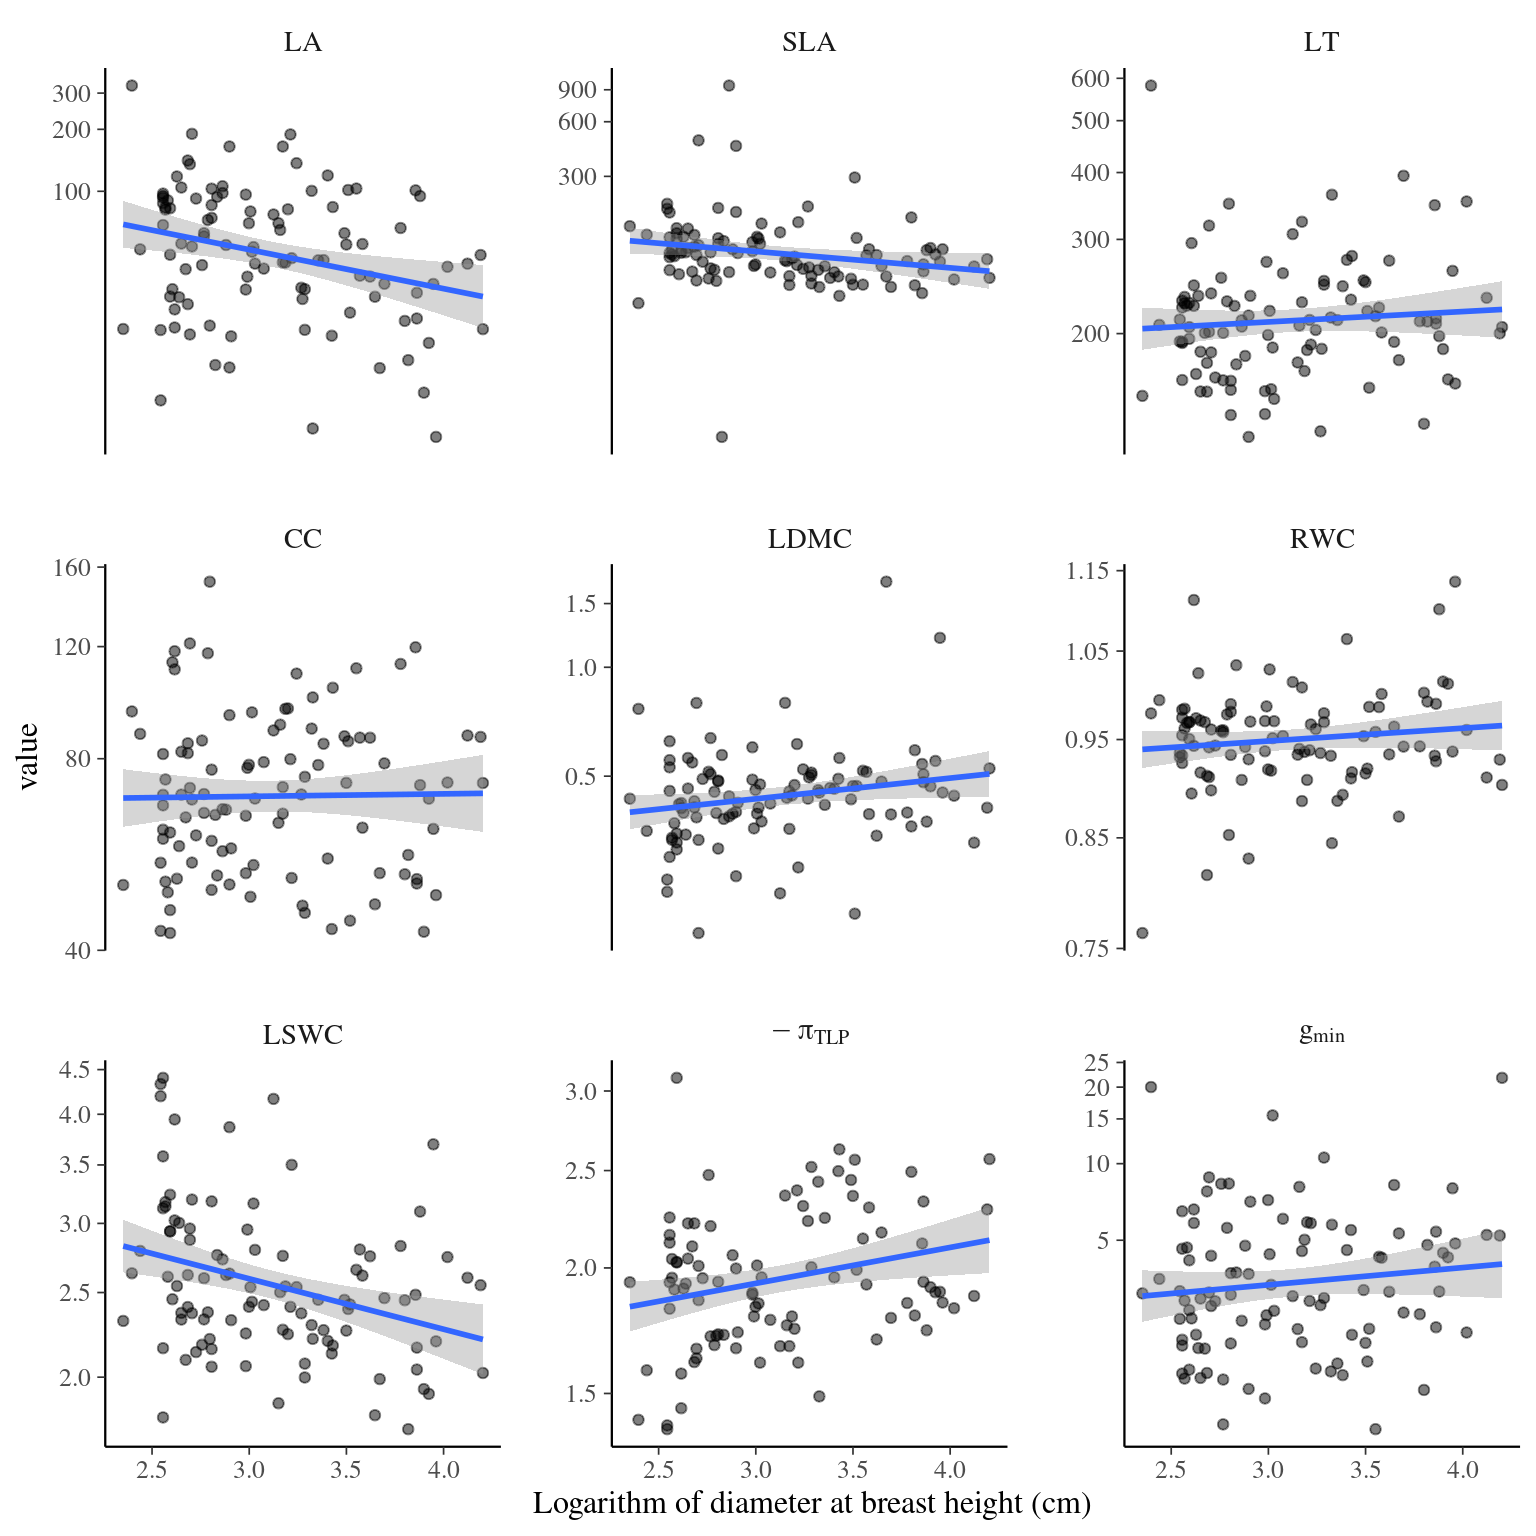
Figure 4.5: Traits distributions when testing for individual variation and diameter.
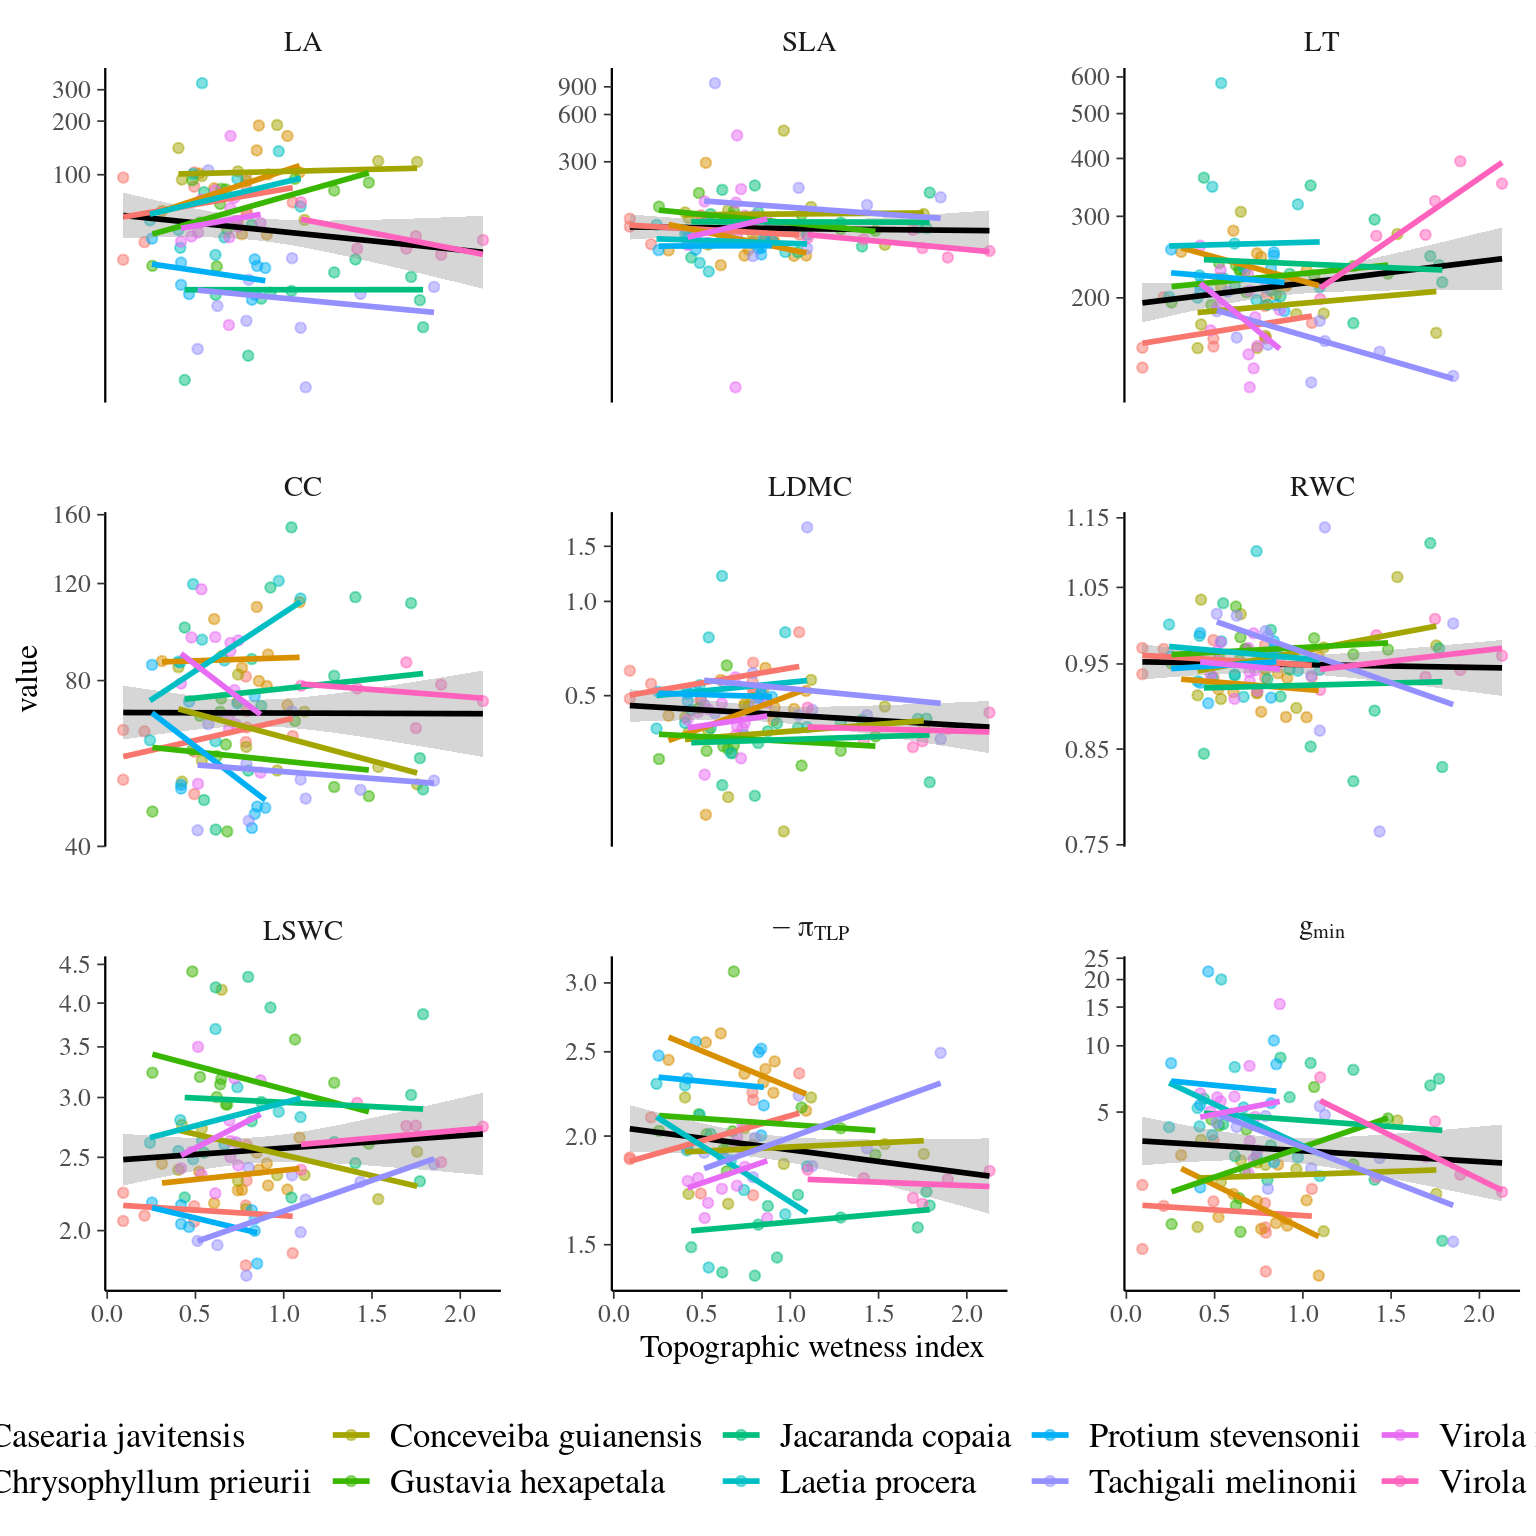
Figure 4.6: Traits distributions when testing for species and individual variation with topography.
4.4.3 Leaf variation
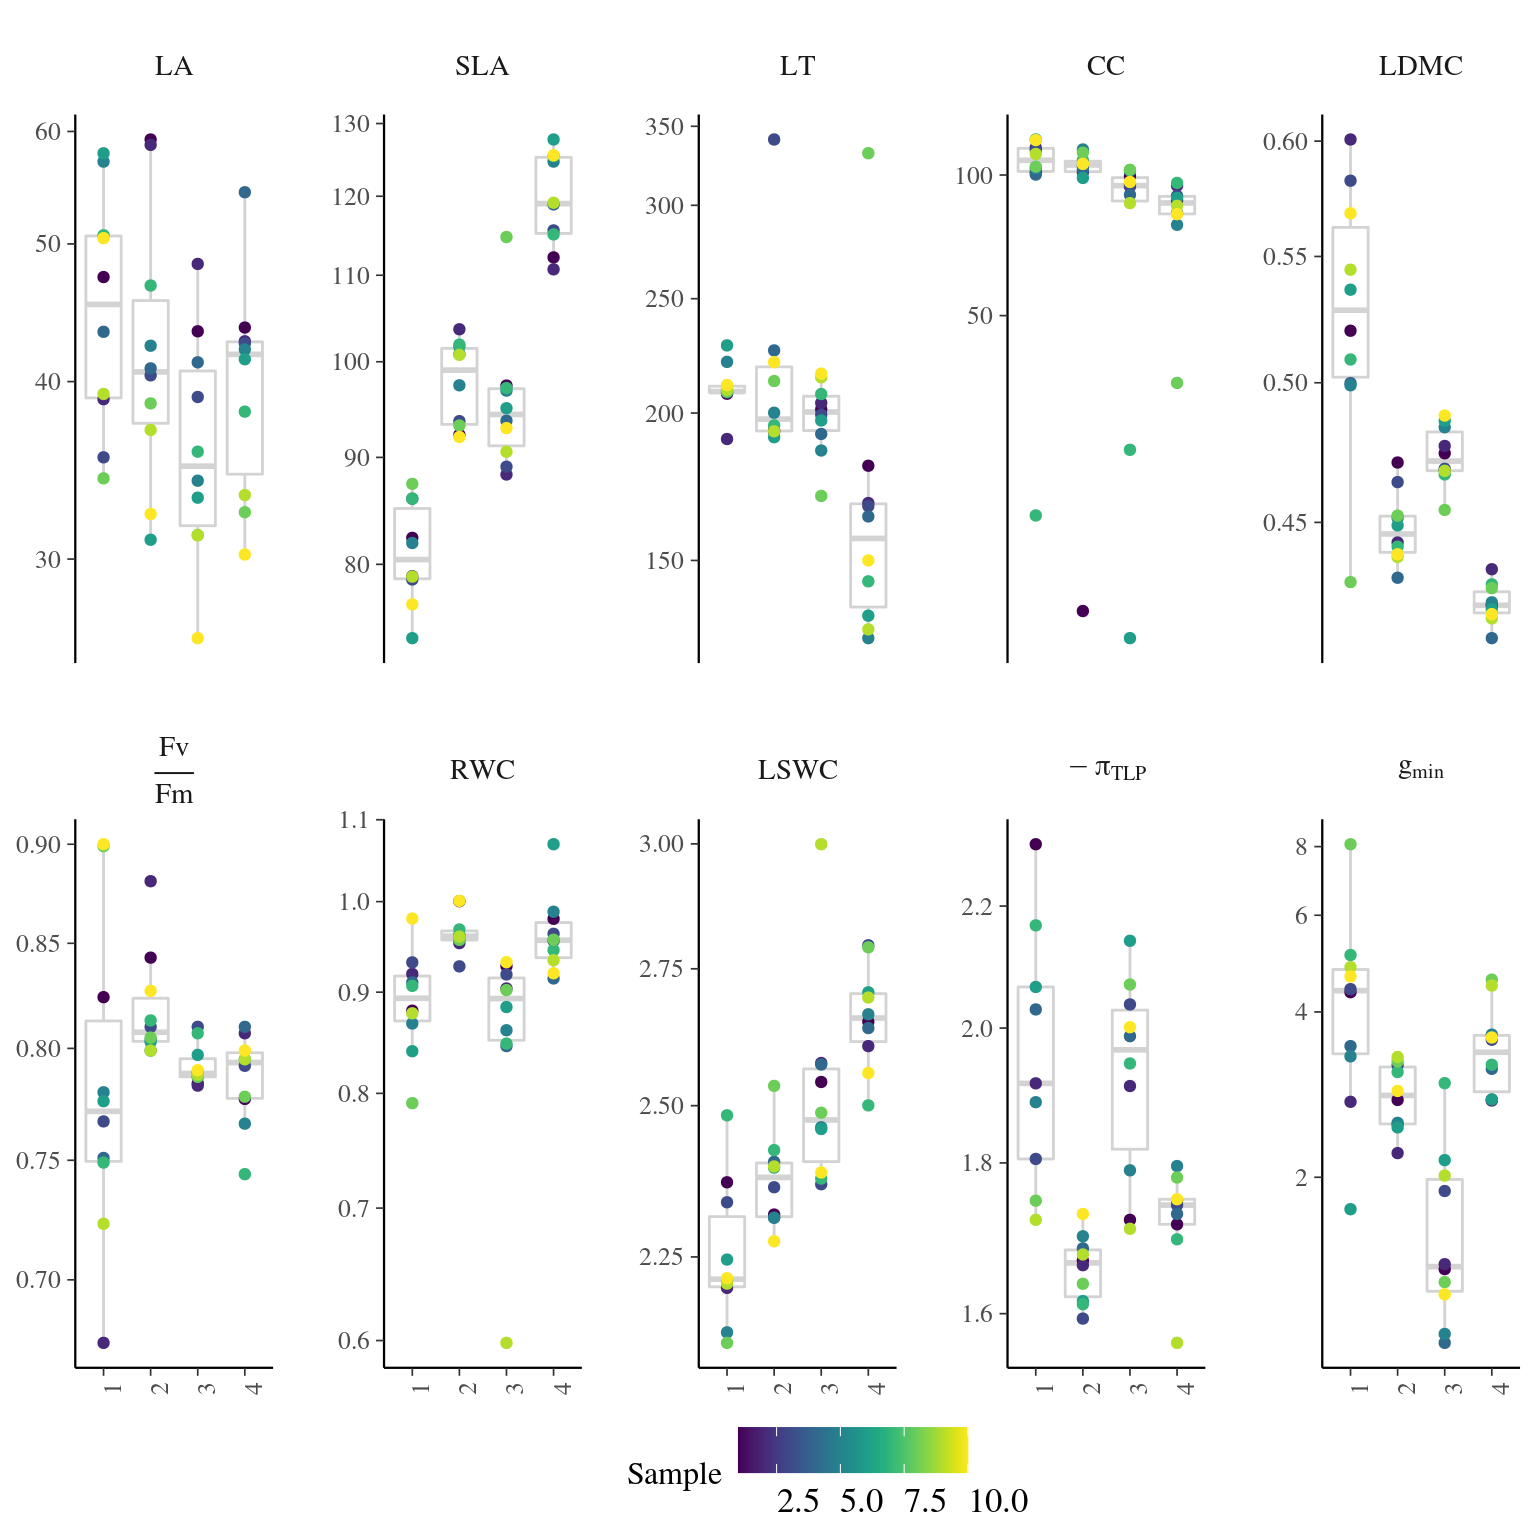
Figure 4.7: Traits distributions when testing for leaf variation.
4.4.4 Measurement error
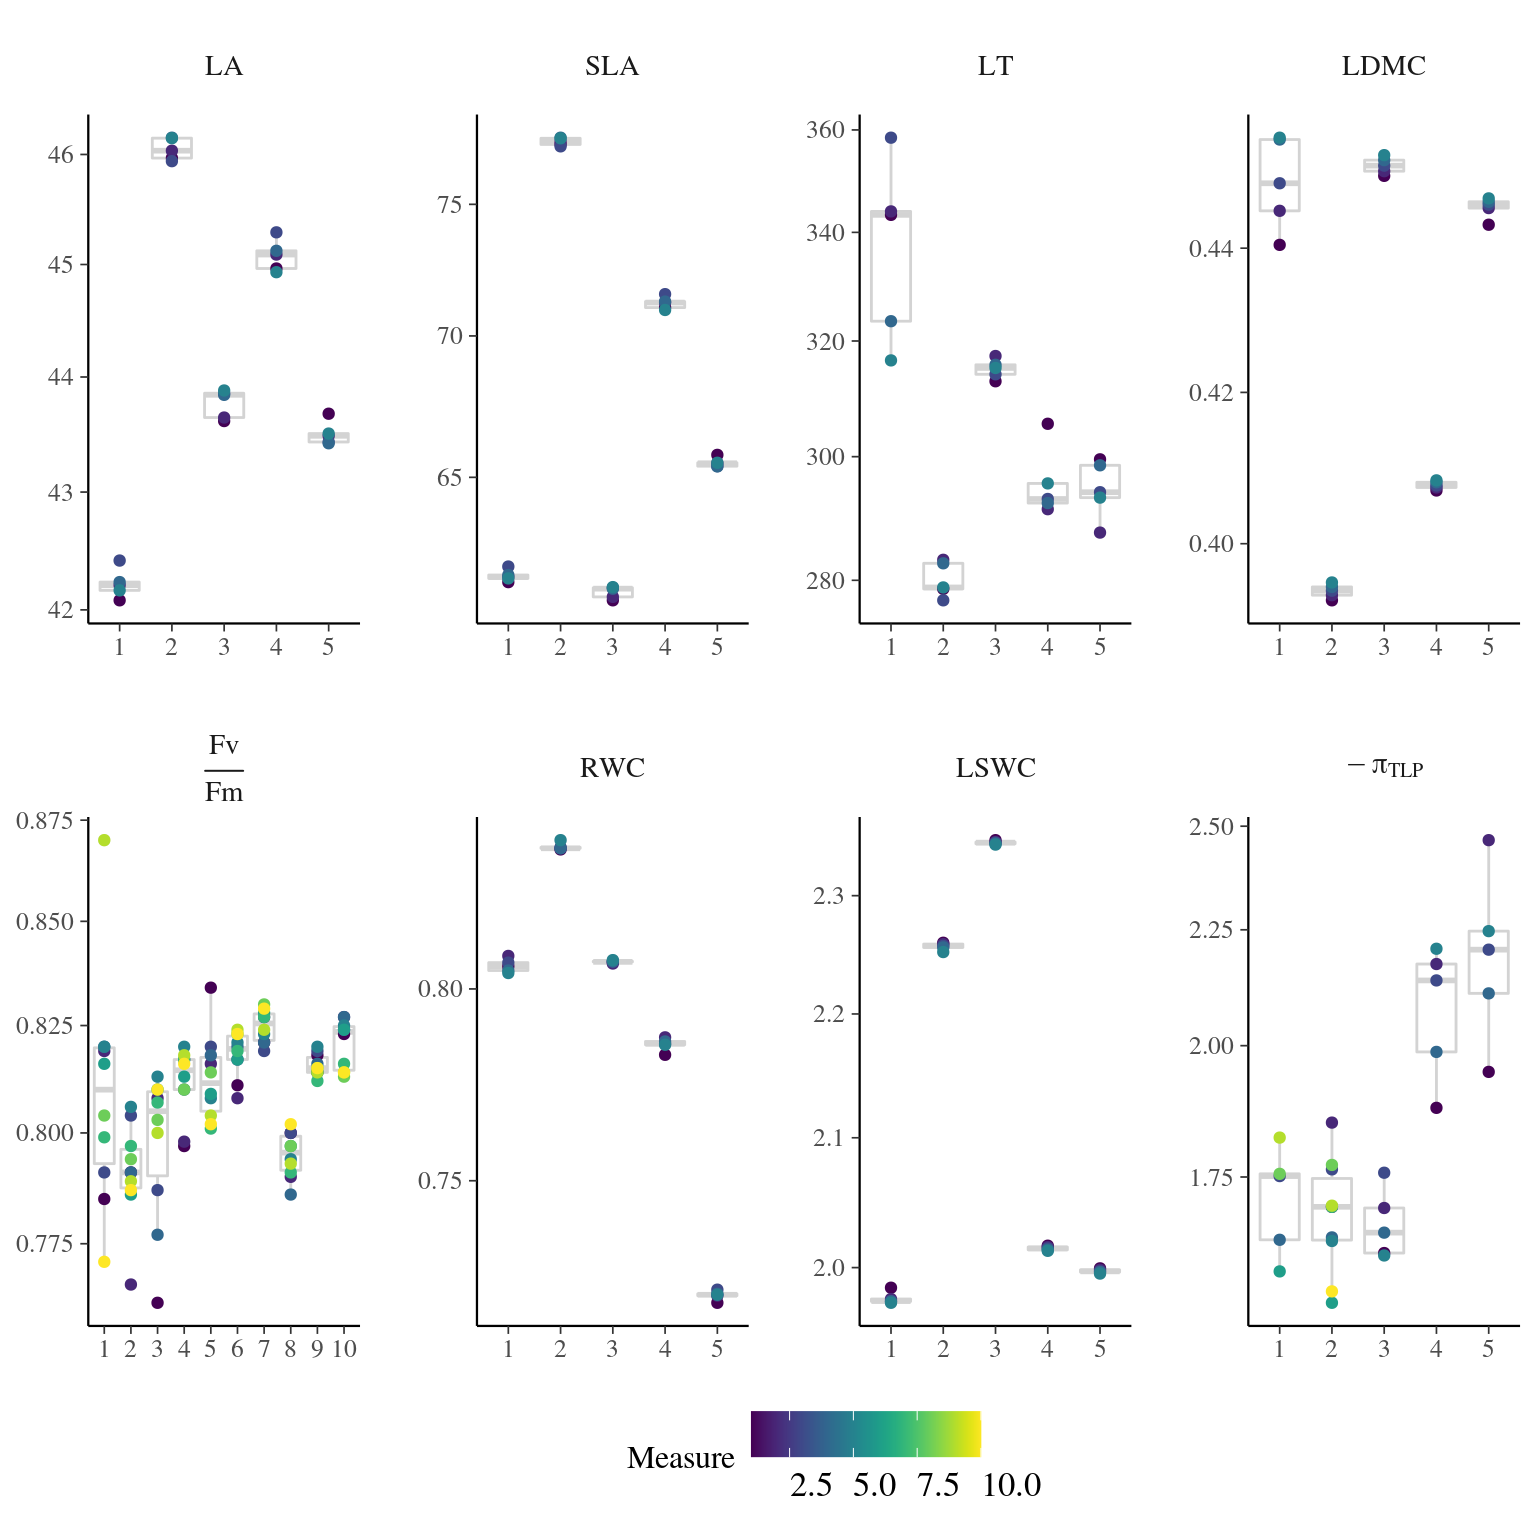
Figure 4.8: Traits distributions when testing for measurement error.
References
Brown, J.H. (1984). On the Relationship between Abundance and Distribution of Species. The American Naturalist, 124, 255–279. Retrieved from https://www.journals.uchicago.edu/doi/10.1086/284267
Clark, J.S. (2010). Individuals and the variation needed for high species diversity in forest trees. Science, 327, 1129–1132. Retrieved from http://science.sciencemag.org/content/327/5969/1129 http://www.sciencemag.org/cgi/doi/10.1126/science.1183506
Helsen, K., Acharya, K.P., Brunet, J., Cousins, S.A.O., Decocq, G., Hermy, M., Kolb, A., Lemke, I.H., Lenoir, J., Plue, J., Verheyen, K., De Frenne, P. & Graae, B.J. (2017). Biotic and abiotic drivers of intraspecific trait variation within plant populations of three herbaceous plant species along a latitudinal gradient. BMC Ecology, 17, 1–12. Retrieved from https://doi.org/10.1186/s12898-017-0151-y
Yang, J., Lu, J., Chen, Y., Yan, E., Hu, J., Wang, X. & Shen, G. (2020). Large Underestimation of Intraspecific Trait Variation and Its Improvements. Frontiers in Plant Science, 11, 1–9.