Chapter 3 Virtual experiment
This chapter explore the sampling design effect on the assessment of trait variation and co-variations. In particular, we explore the importance of a balanced design, in contrast to the many papers reporting inter- and intraspecific variation in unbalanced designs.
3.1 Material
We first simulated a trait for \(S=100\) species with mean trait values sampled in a normal law centered on 10 with an among-species trait variance \(\sigma_{S}=1\), including each \(I=100\) individuals per species with trait values sampled in a normal law centered on species mean with a within-species trait variance \(\sigma_{I}=1\).
We then simulated \(T=8\) traits
for \(S=100\) species with mean trait values sampled in a multinormal law centered on 10
with an among-species trait variance factor of \(\sigma_{S}=10\),
including each \(I=100\) individuals per species with trait values sampled in a multinormal law centered on species mean
with a within-species trait variance factor \(\sigma_{I}=1\).
The covariance matrix was generated using the rcorrmatrix function from package clusterGeneration.
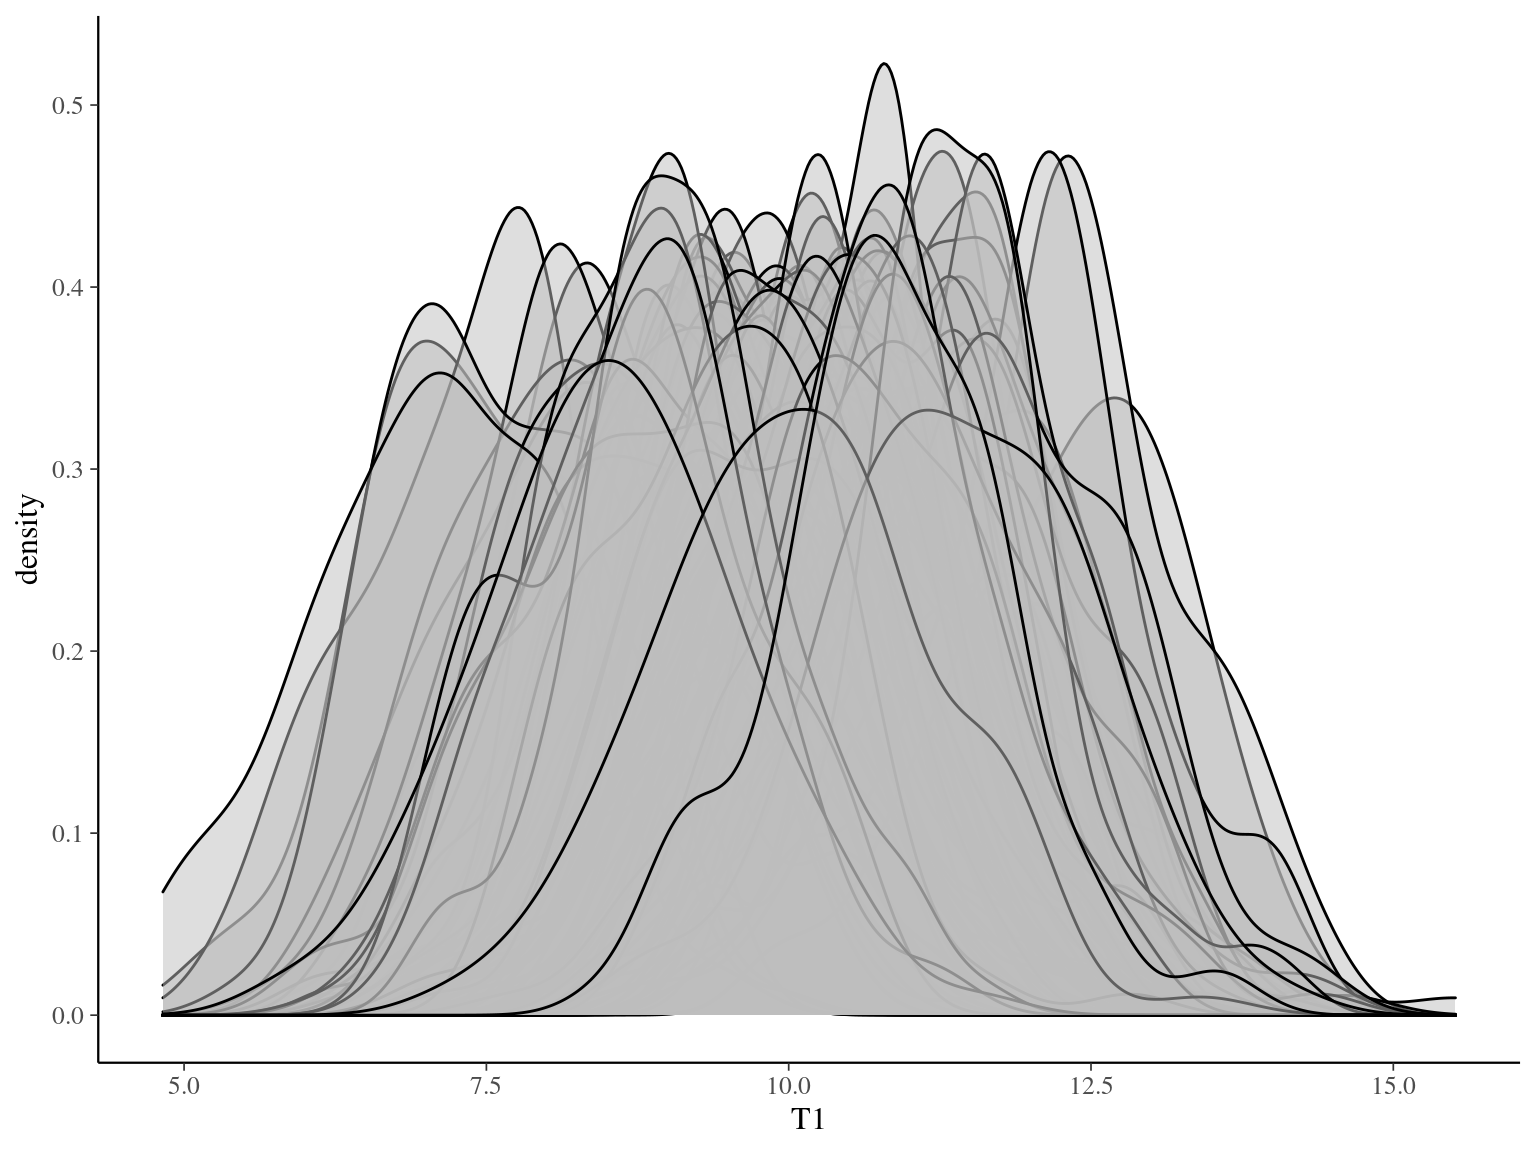
Figure 3.1: Trait distribution in the virtual community for univariate virtual data.
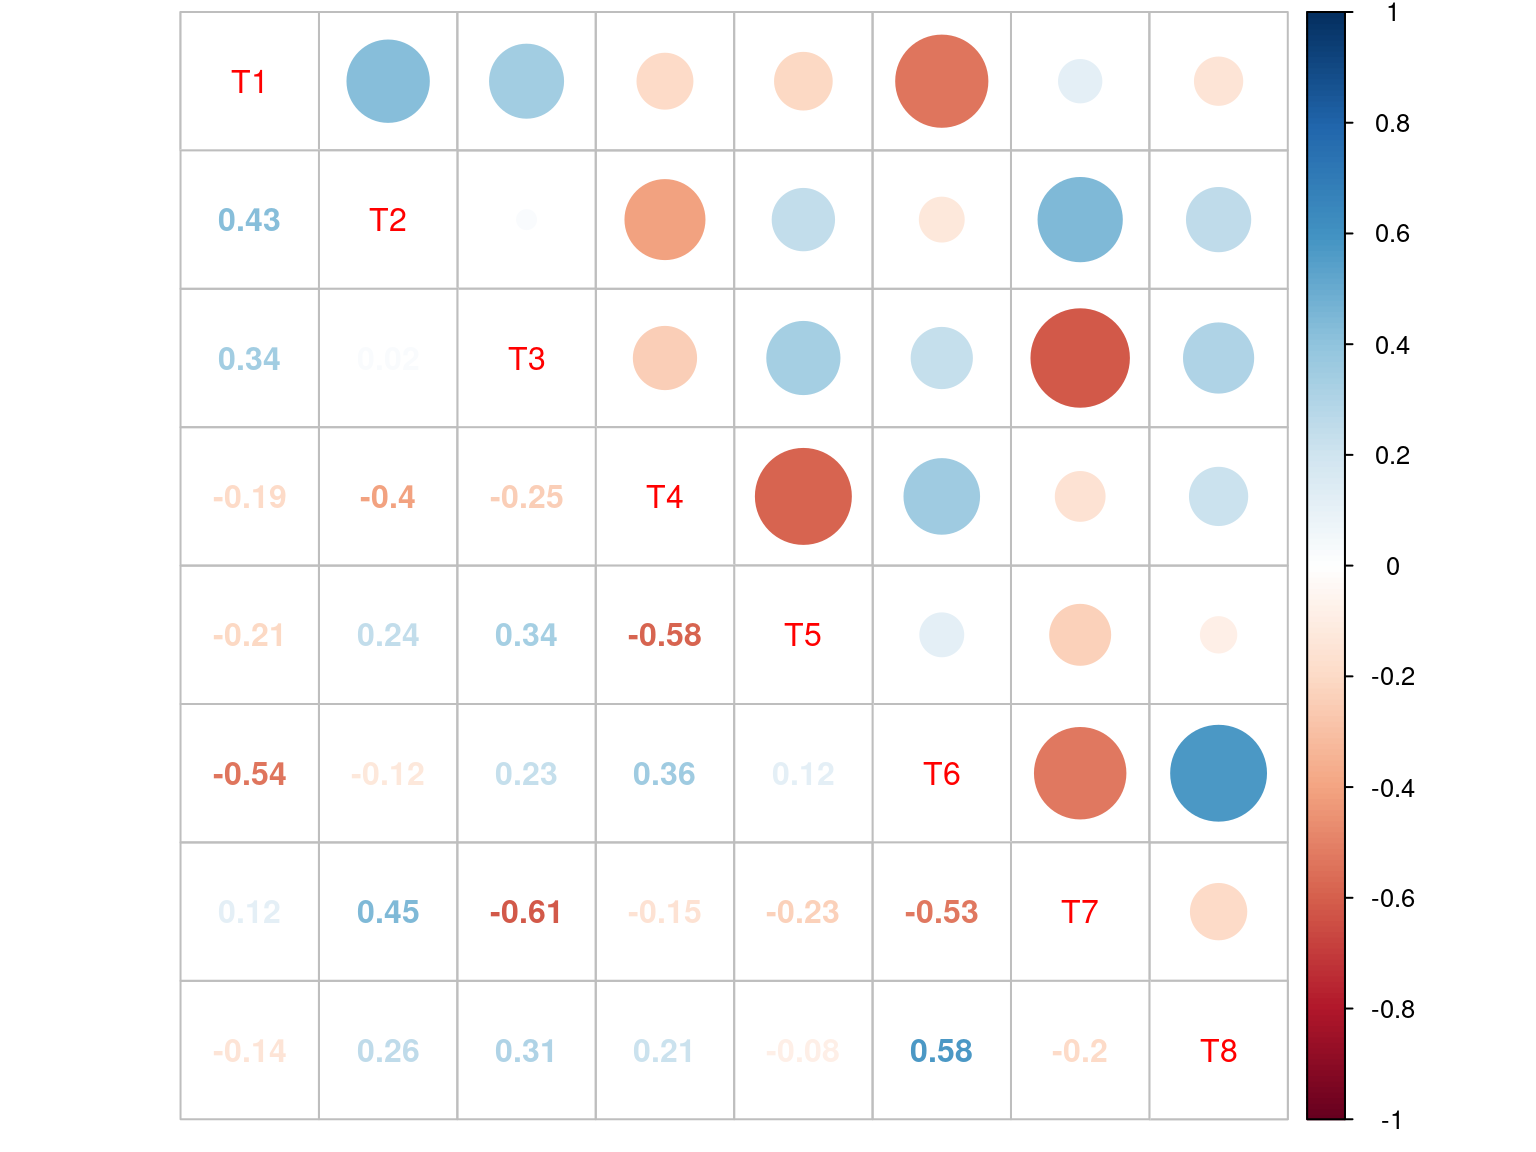
Figure 3.2: Correlations among simulated traits for multivariate virtual data.
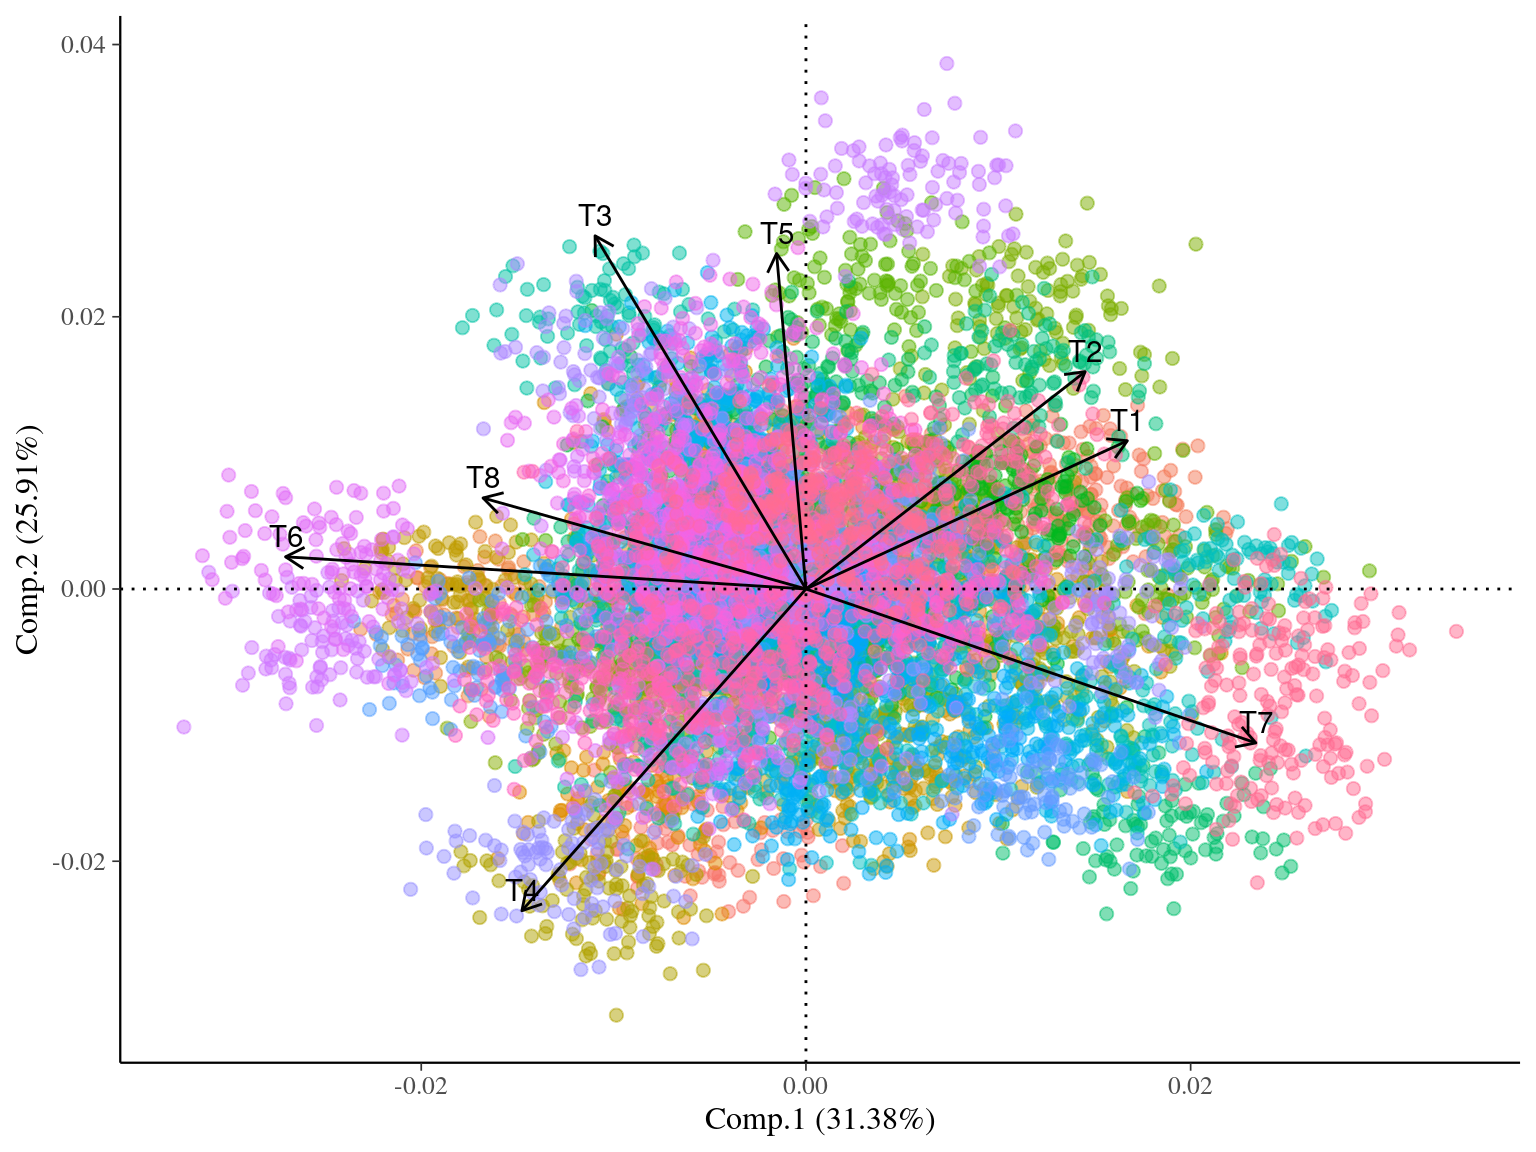
Figure 3.3: Among-species principal component analysis (PCA) with simulated traits for multivariate virtual data.
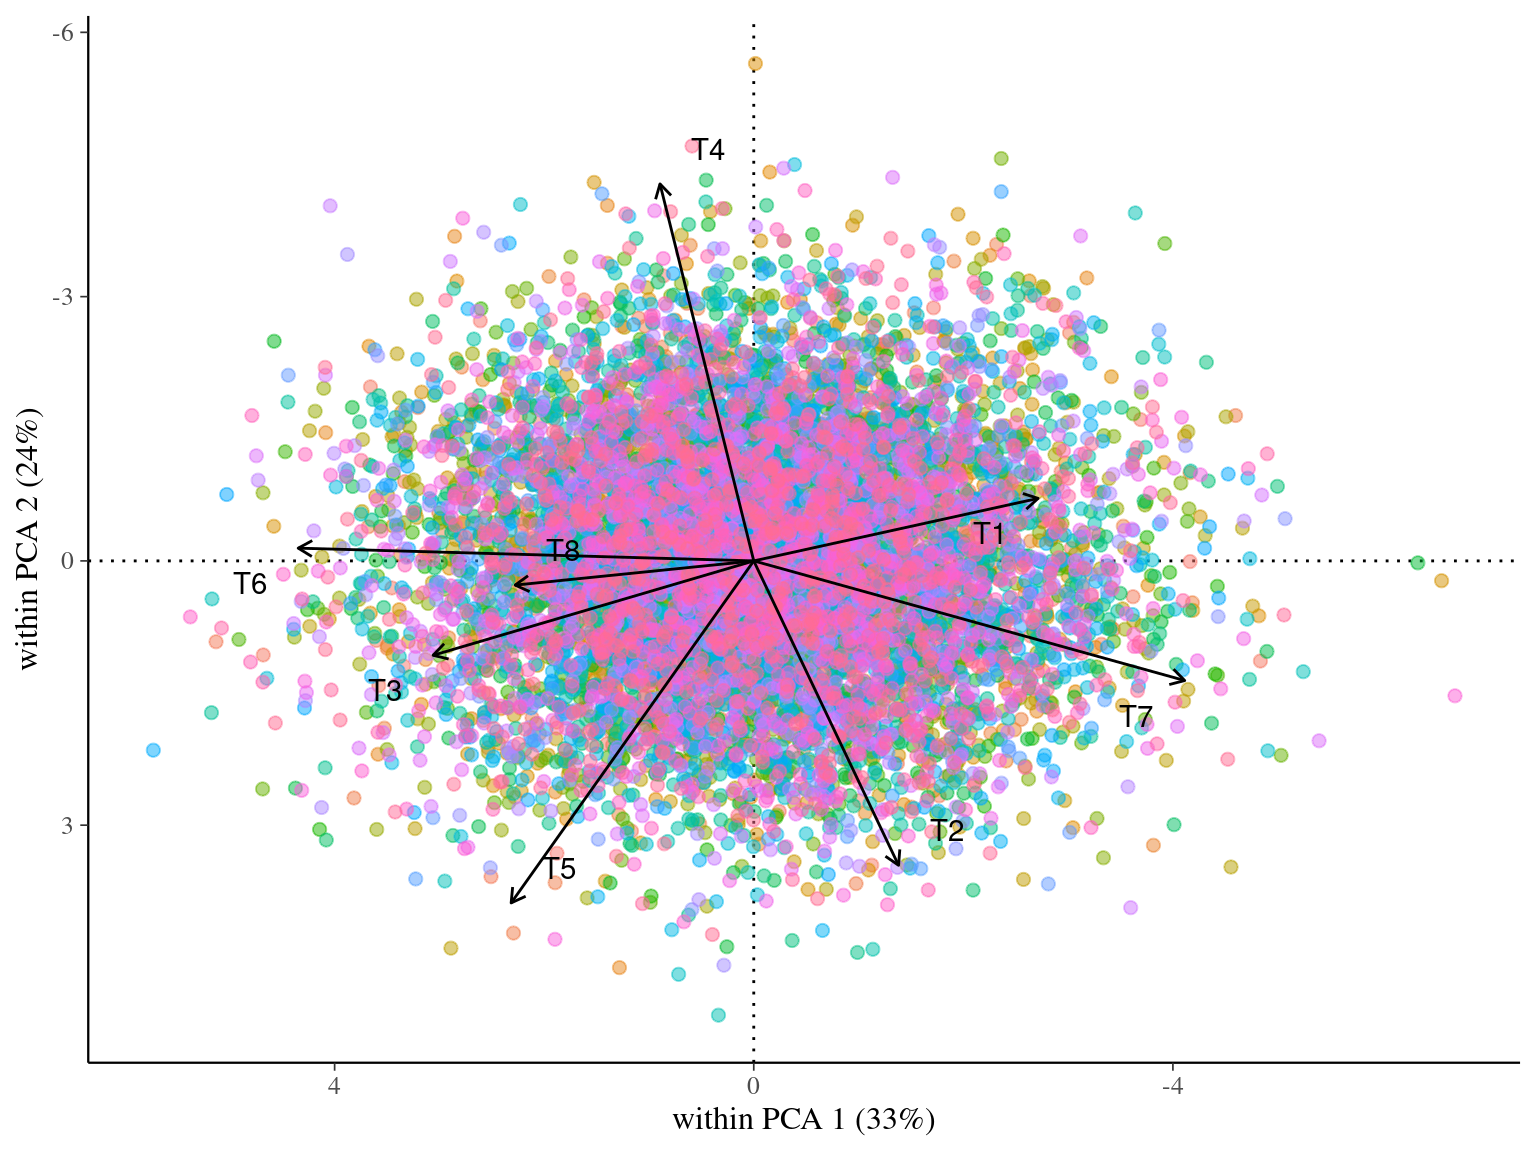
Figure 3.4: Within-species principal component analysis (wPCA) with simulated traits for multivariate virtual data.
3.2 Methods
We repeated 100 times 3 sampling strategies on virtual data (e.g. for two repetitions in Fig. 3.5):
- sampling of 100 individuals unbalanced in species (25 species with 4 individuals)
- sampling of 100 individuals unbalanced in individuals (4 species with 25 individuals)
- sampling of 100 individuals balanced in species and individual (10 species with 10 individuals)
We tested 4 metrics:
- The coefficient of variation \(CV_4\)
- The variance partitioning using linear mixed models
- Other traits correlations with T1
- Other traits within-species correlations with T1 when centering each trait per species
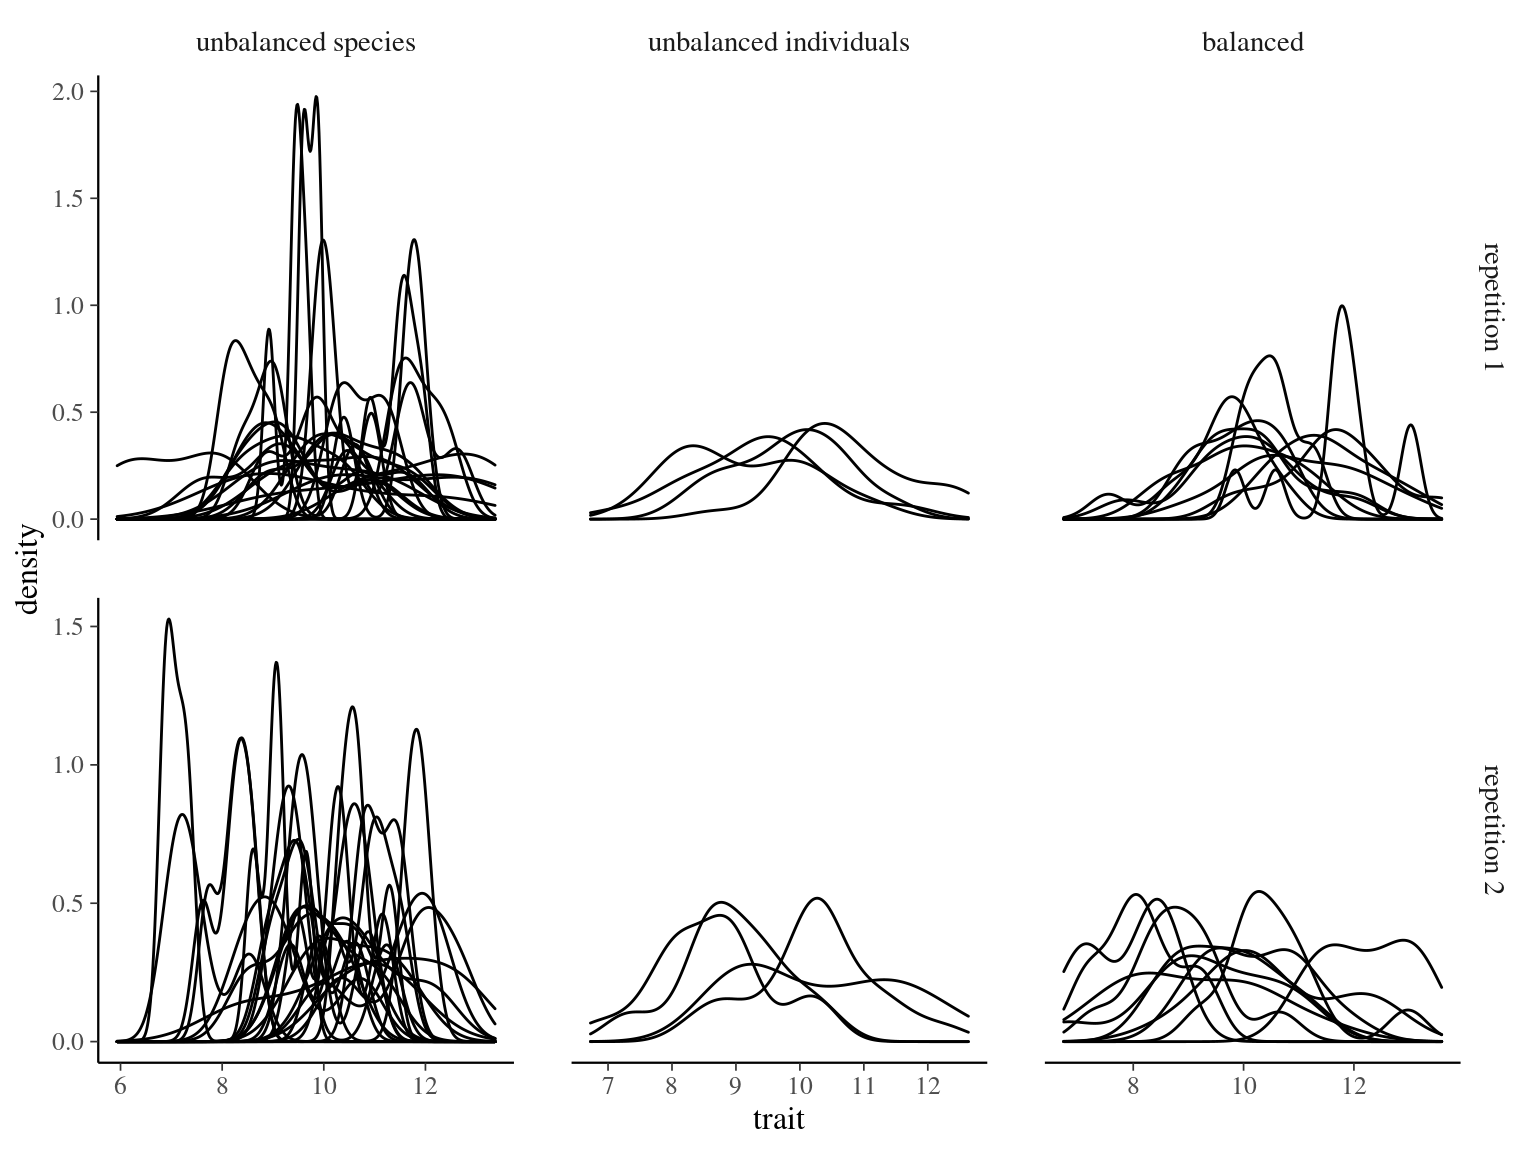
Figure 3.5: Trait distribution per species after sampling with balanced and unbalanced sampling designs with two repetitions.
3.3 Results
3.3.1 Trait variation
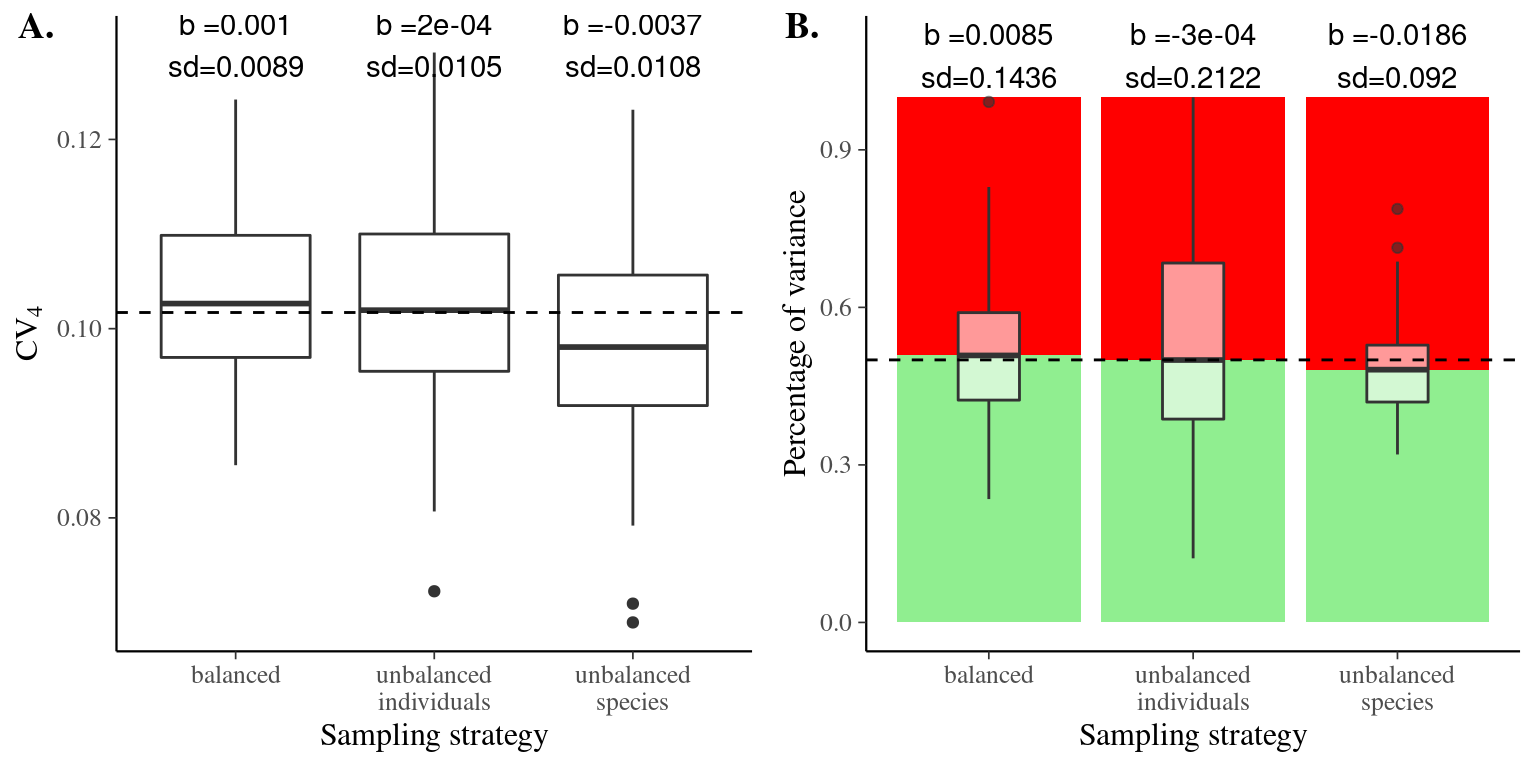
Both the coefficient of variation and the variance partitioning are best estimated with unbalanced sampling favoring individuals (boxplots medians in Fig. 3.6 and Fig. 3.7), but balanced sampling is very close and has less uncertainties (boxplots variances in Fig. 3.6 and Fig. 3.7). Unbalanced sampling favoring species bias the coefficient of variation and the variance partitioning toward lower values of intraspecific variation. Consequently balanced sampling seems the best strategy to assess trait variation in the community with both coefficient of variation and variance partitioning using linear mixed models.
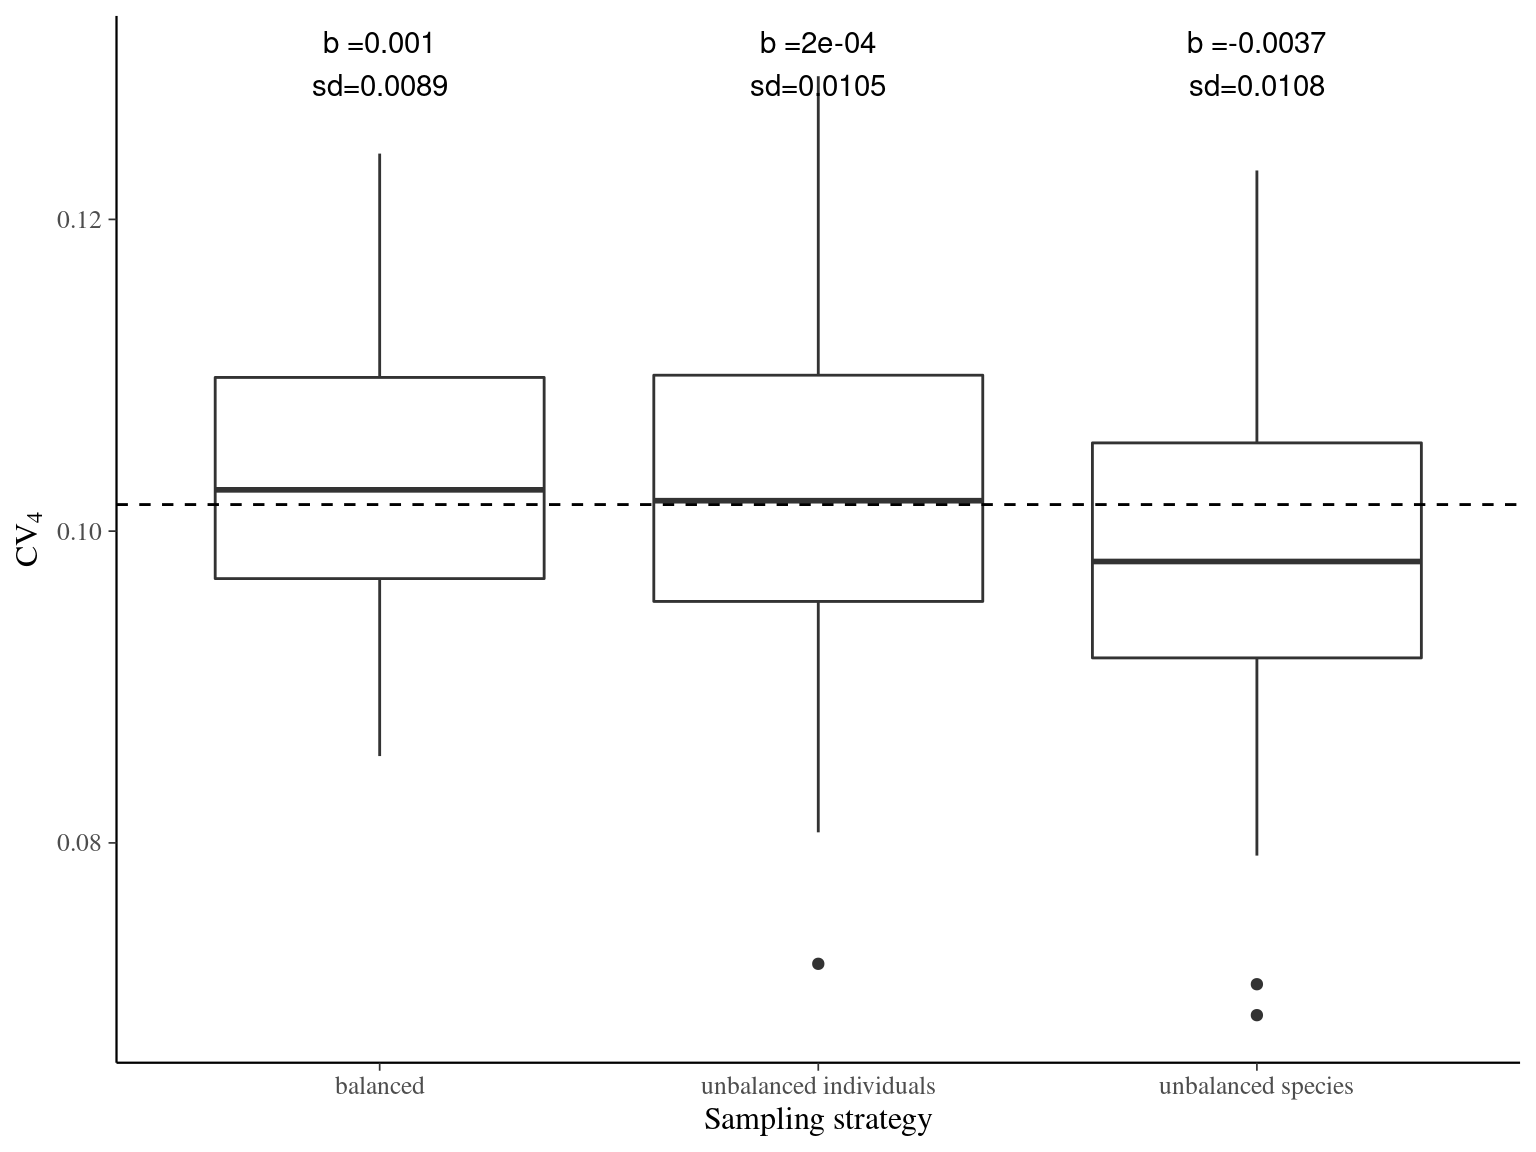
Figure 3.6: Effect of the sampling strategy on the coefficient of variation. Coefficients of variation were obtained 100 times for every sampling strategy: 4 individuals in 25 species (unbalanced species), 25 individuals in 4 species (unbalanced individuals), and 10 individuals in 10 species (balanced). Dashed line represents the expected variance partitioning based on the full community of 100 individuals in 100 species.
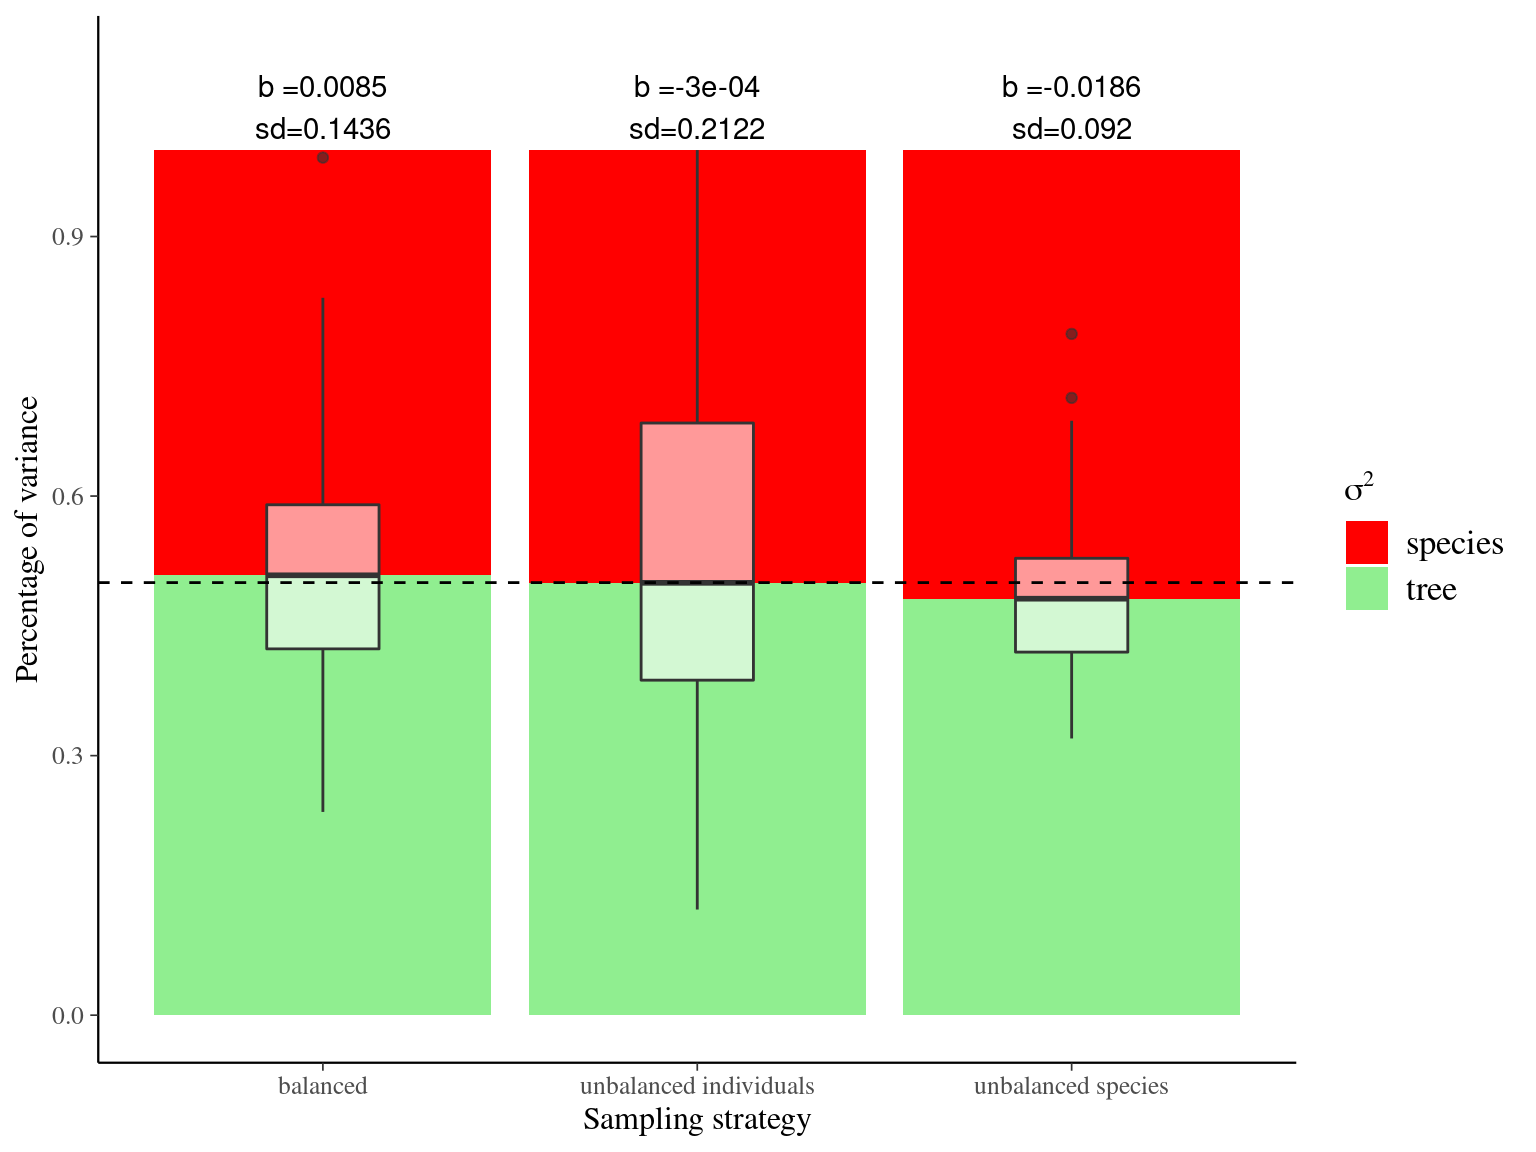
Figure 3.7: Effect of the sampling strategy on variance partitioning. Variance partitionings were obtained 100 times using linear mixed models for every sampling strategy: 4 individuals in 25 species (unbalanced species), 25 individuals in 4 species (unbalanced individuals), and 10 individuals in 10 species (balanced). Dashed line represents the expected variance partitioning based on the full community of 100 individuals in 100 species.
3.3.2 Trait co-variation
Unbalanced sampling favoring species better estimate among-species correlations for traits (Fig. 3.8) and unbalanced sampling favoring individuals better estimate within-species correlations for traits (Fig. 3.9), but balanced sampling may have good estimations at both level to jointly estimate the two (e.g. T4 correlations in Fig. 3.8 and Fig. 3.9).
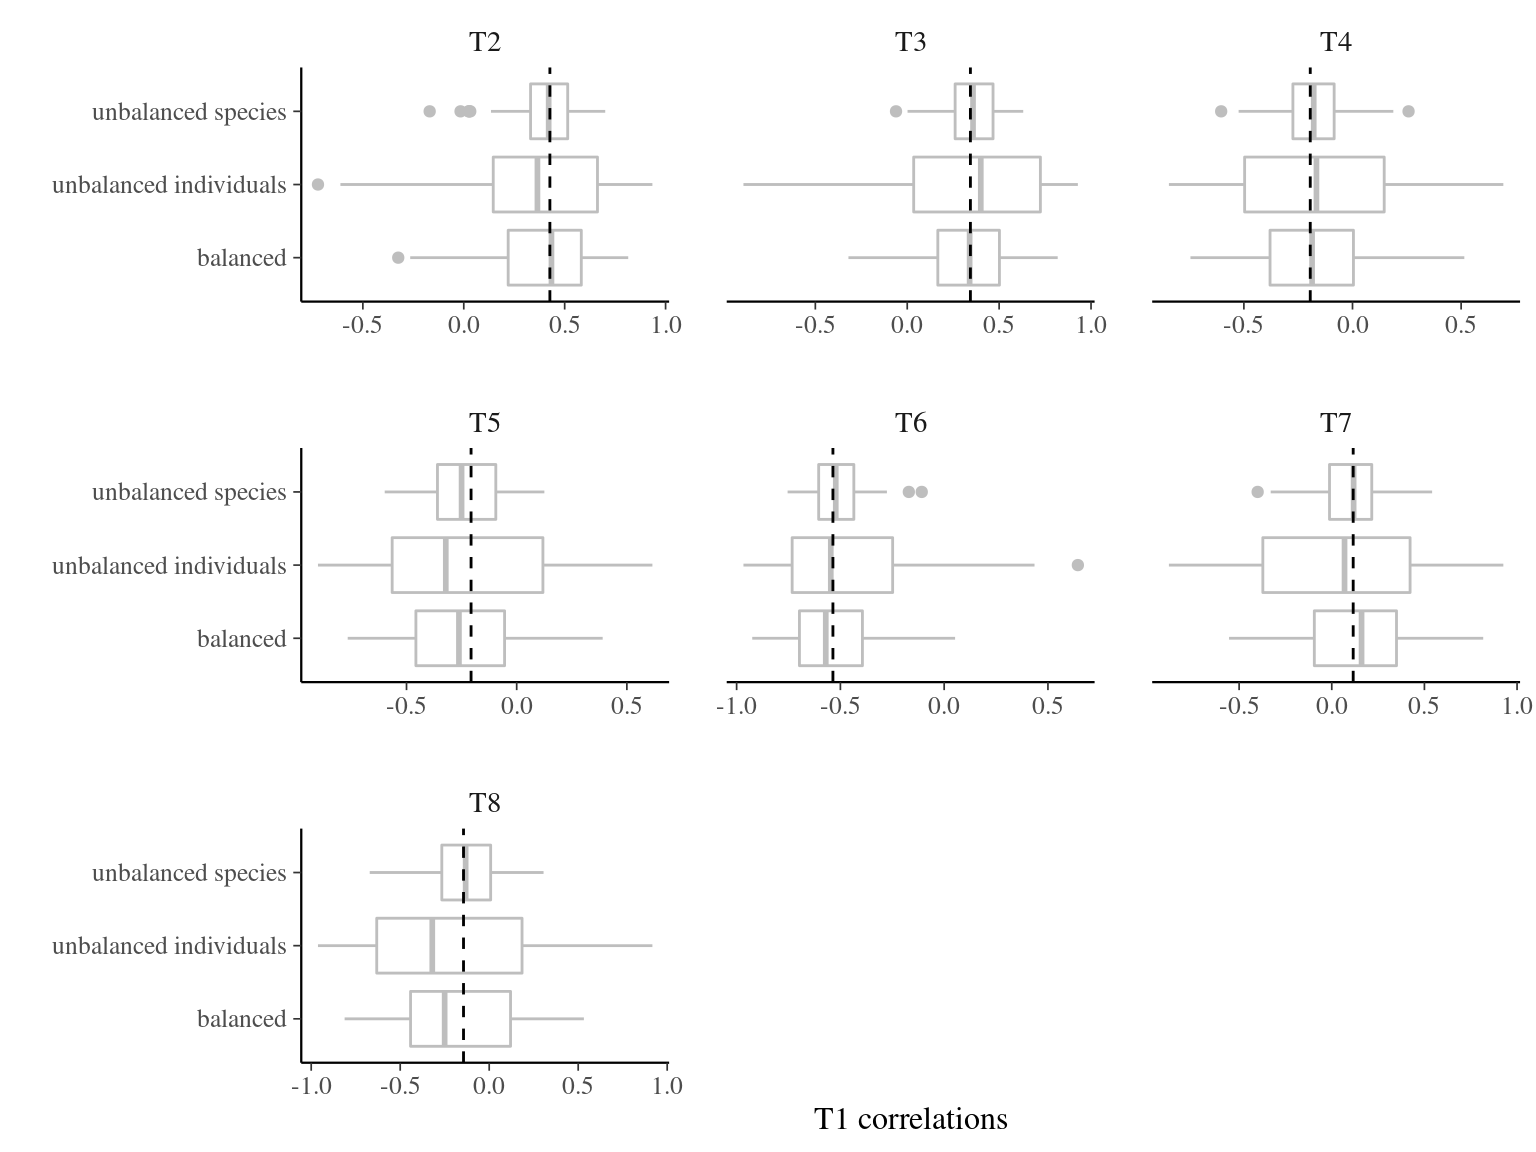
Figure 3.8: Effect of the sampling strategy on other traits correlations with T1. Correlations with T1 were obtained 100 times for every sampling strategy: 4 individuals in 25 species (unbalanced species), 25 individuals in 4 species (unbalanced individuals), and 10 individuals in 10 species (balanced). Dashed line represents the expected variance partitioning based on the full community of 100 individuals in 100 species.
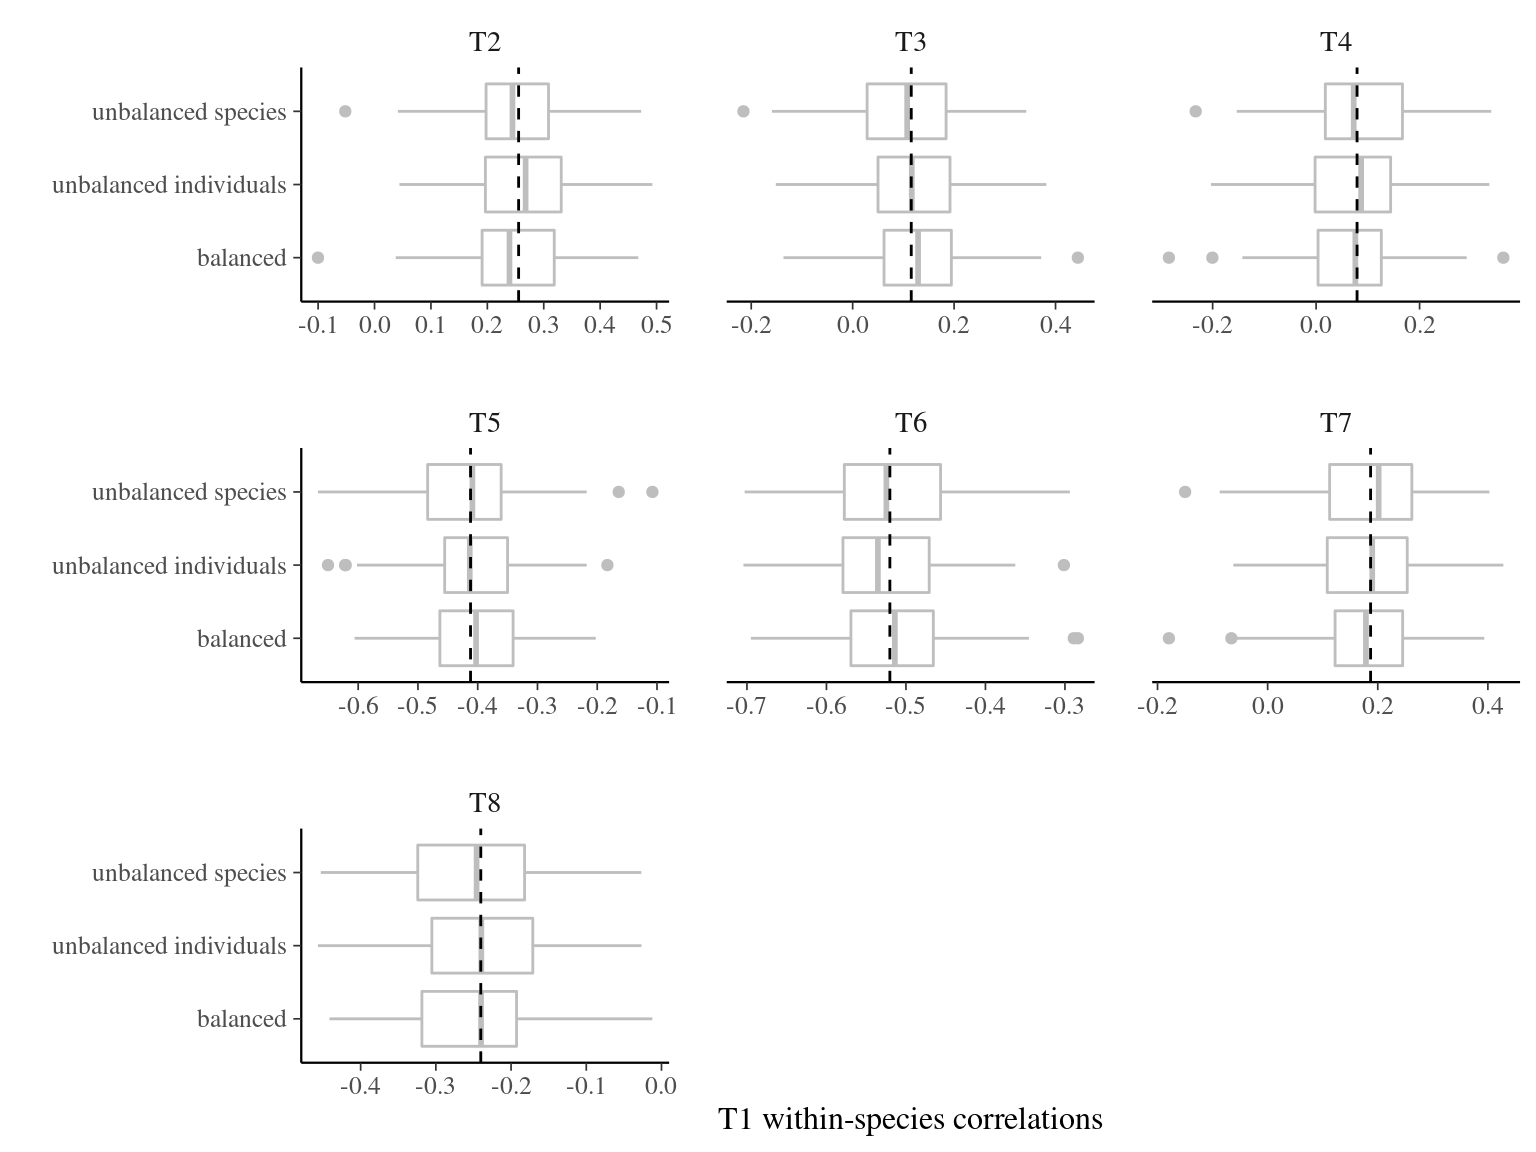
Figure 3.9: Effect of the sampling strategy on other traits correlations with T1 when centering each trait per species. Correlations with T1 were obtained 100 times for every sampling strategy: 4 individuals in 25 species (unbalanced species), 25 individuals in 4 species (unbalanced individuals), and 10 individuals in 10 species (balanced). Dashed line represents the expected variance partitioning based on the full community of 100 individuals in 100 species.
3.4 Discussion
Balanced sampling is the best strategy to assess trait variation in the community with both coefficient of variation and variance partitioning using linear mixed models (Fig. 3.6 and Fig. 3.7). But unbalanced sampling favoring the studied level is better suited to assess traits covariations in the community, despite interesting results of balanced sampling for a joint estimate of correlations at species and individuals levels (Fig. 3.8 and Fig. 3.9).
3.5 SI
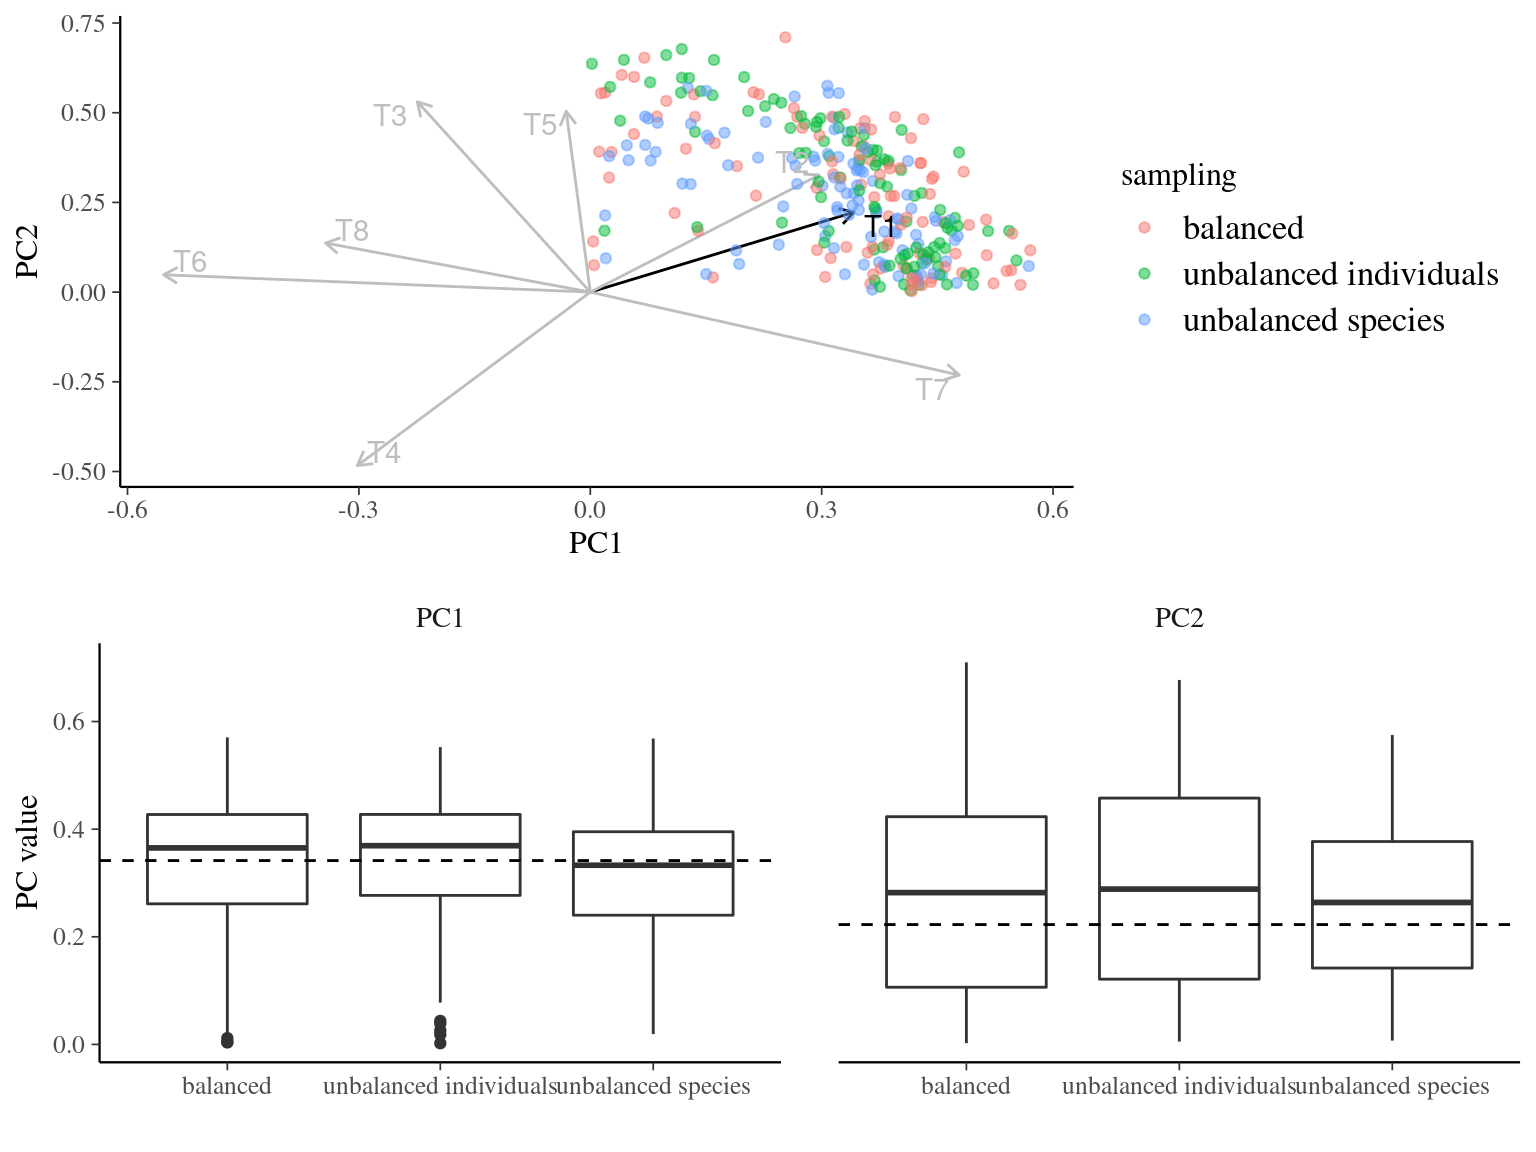
Figure 3.10: Effect of the sampling strategy on principal component analysis with T1. Principal component analysis were obtained 100 times for every sampling strategy: 4 individuals in 25 species (unbalanced species), 25 individuals in 4 species (unbalanced individuals), and 10 individuals in 10 species (balanced). Dashed line represents the expected variance partitioning based on the full community of 100 individuals in 100 species.
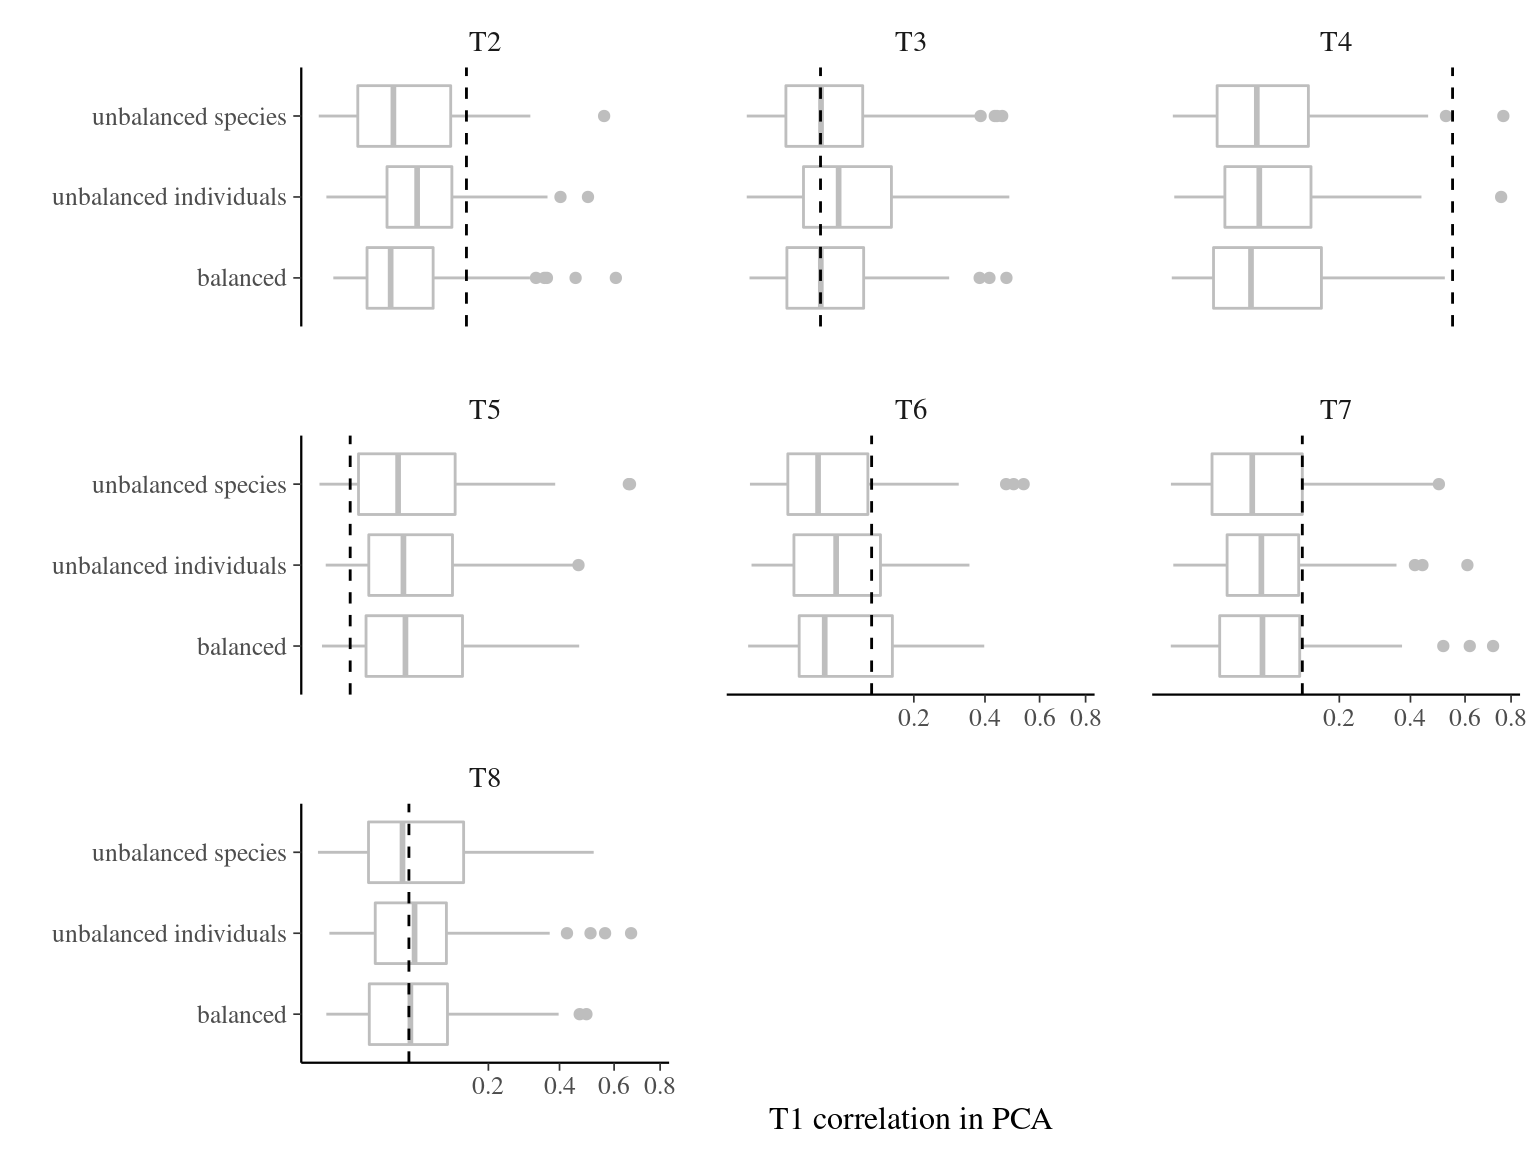
Figure 3.11: Effect of the sampling strategy on principal component analysis correlations with T1. Principal component analysis were obtained 100 times for every sampling strategy: 4 individuals in 25 species (unbalanced species), 25 individuals in 4 species (unbalanced individuals), and 10 individuals in 10 species (balanced). Dashed line represents the expected variance partitioning based on the full community of 100 individuals in 100 species.