D Appendix 4: Sensitivity analysis
To study resistance and resilience of ecosystem face to disturbance, highlighting the role of biodiversity, we decided to use TROLL model simulations (Chave 1999). In order to get a finer study of simulations response, we needed to assess sensitivity of the TROLL model to different parameters. More particularly we needed to assess the importance of functional traits to further better control functional diversities in simulations. We also needed to assess sensitivity of the model to see rain constant because we assumed it was one of the main factor of tree recruitments after disturbance in the model.
D.1 Material and methods
To assess the sensitivity of TROLL model to species functionnal traits, we performed a sensitivity analysis by fixing species trait values to their mean. Each trait was tested independently. We reduced to a common mean traits with a correlation \(r \geq 0.8\) (see figure D.1).
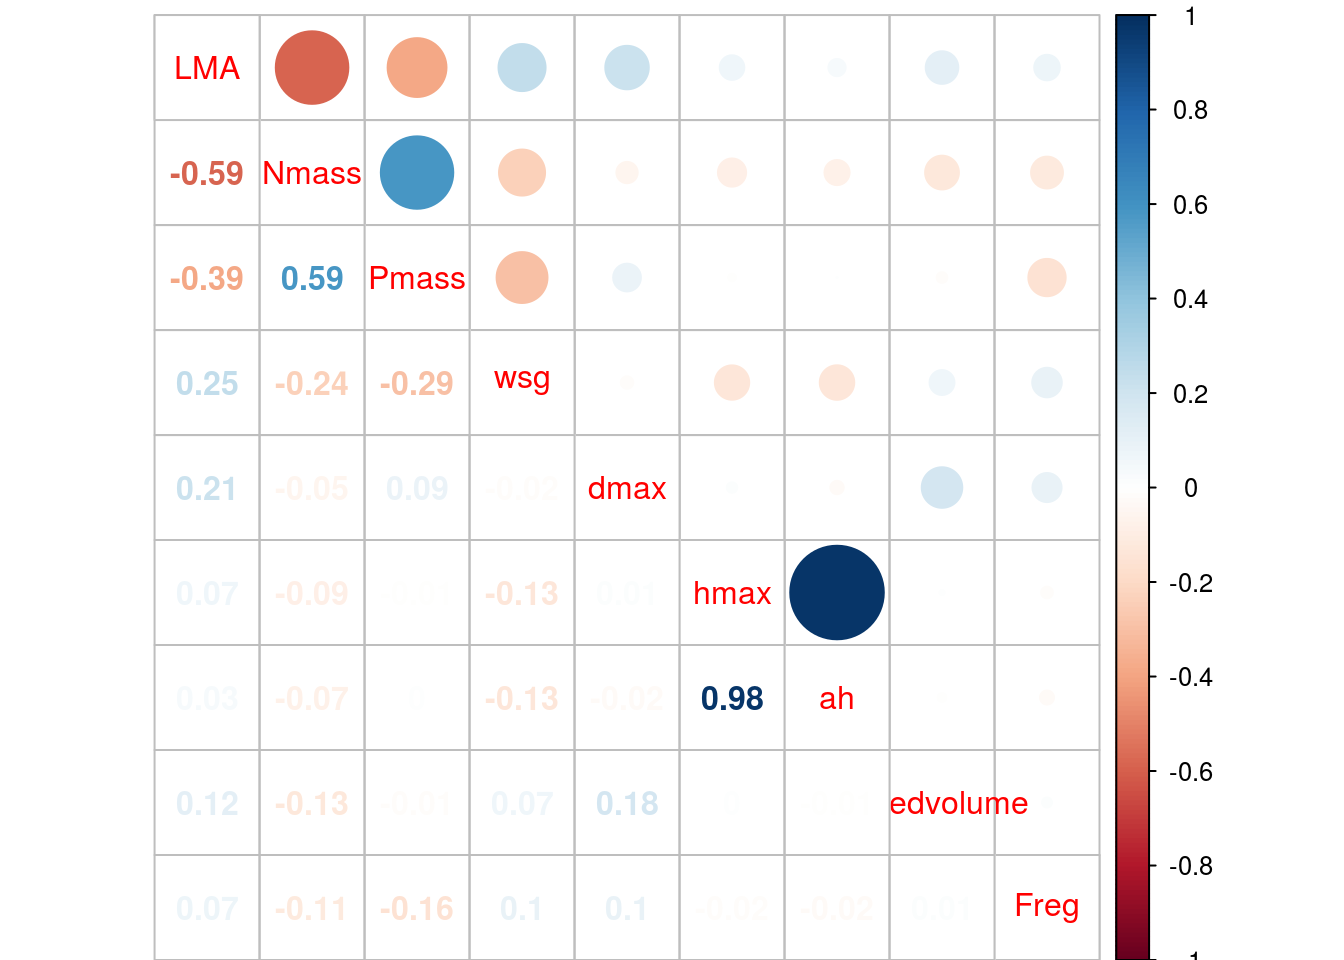
Figure D.1: Correlation of functional traits within TROLL model species Blue represents negative coorelations whereas red represents positive correlations. Values and colour intensity represents correlation values.
To assess the sensitivity of TROLL model to seed rain, we performed a sensitivity analysis by fixing simulations seed rain constant to 2, 20, 200 and 2000 seeds per hectare.
Simulations were conducted on Intel Xeon(R) with 32 CPUs of 2.00GHz and 188.9 GB of memory. We assumed maturity of the forest after 500 years of regeneration (Maréchaux & Chave) and computed simulation 100 years after a disturbance event of 40% intensity. Due to computer limitations we did not run replicates (besides it should be necessary to reduce simulation stochasticity). To assess ecosystem outputs sensitivity to studied parameters, we compared it to 100 replicates of control simulations with all parameters set to default values. Ecosystem outputs outside of the range of the control replicates values are significantly influenced by the studied parameter.
D.2 Results
D.2.1 Control
Both disturbed ecosystem structure and functional composition corresponded to ecosystem structure and functional composition before disturbance (figure D.2). Consequently, we assumed that disturbance did not affect much ecosystem structure and function. Secondly range of values inside control replicates is low (figure D.3).
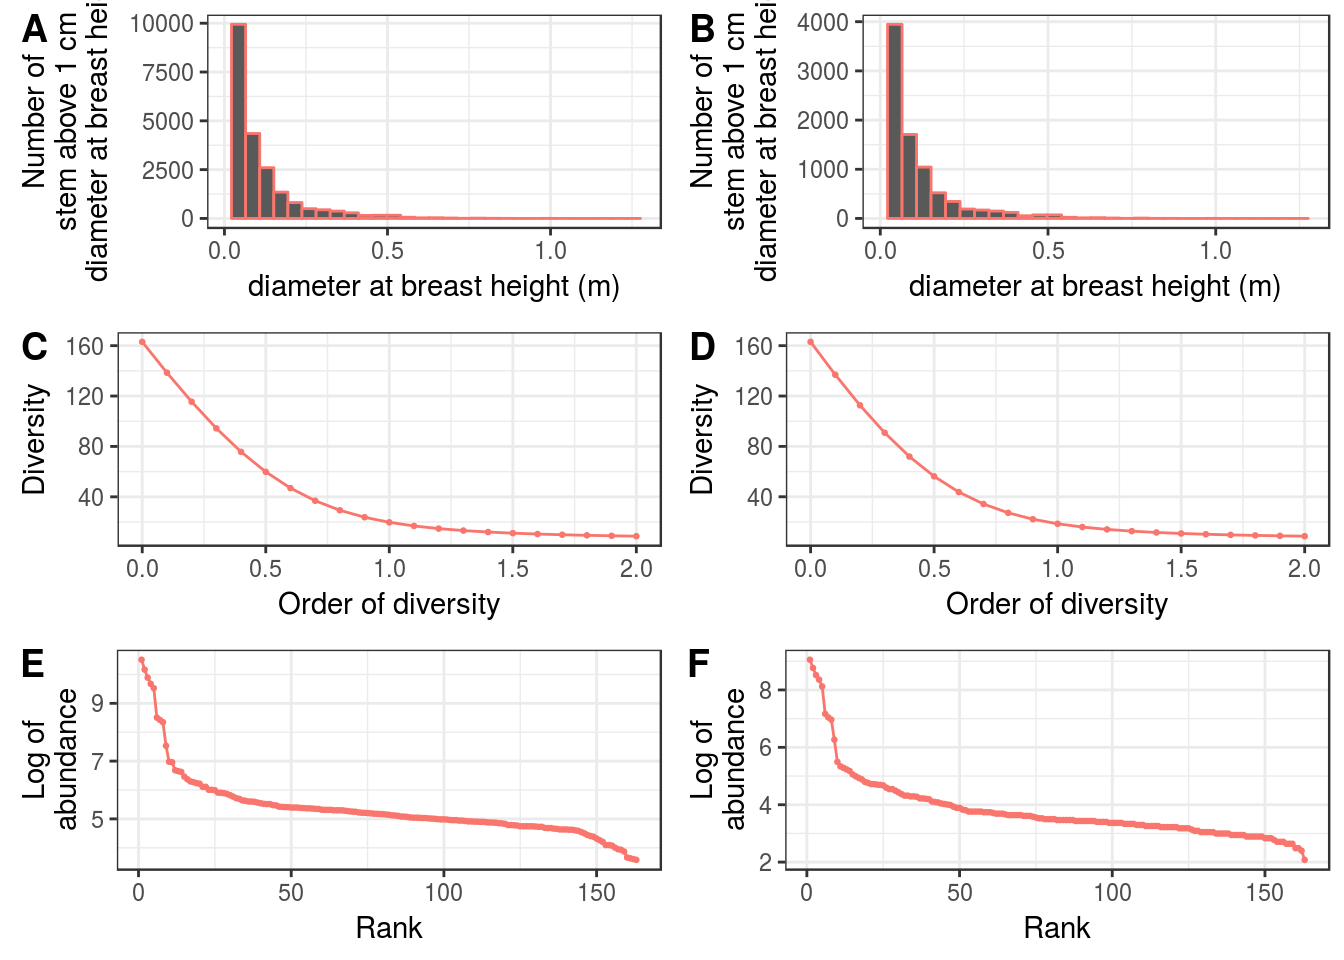
Figure D.2: Ecosystem structure before disturbance and disturbed. Ecosystem structure before disturbance (left) and disturbed (right) with diameter structure (A, B), diversity at different orders (C, D) and rank-abundance diagrams (E, F).
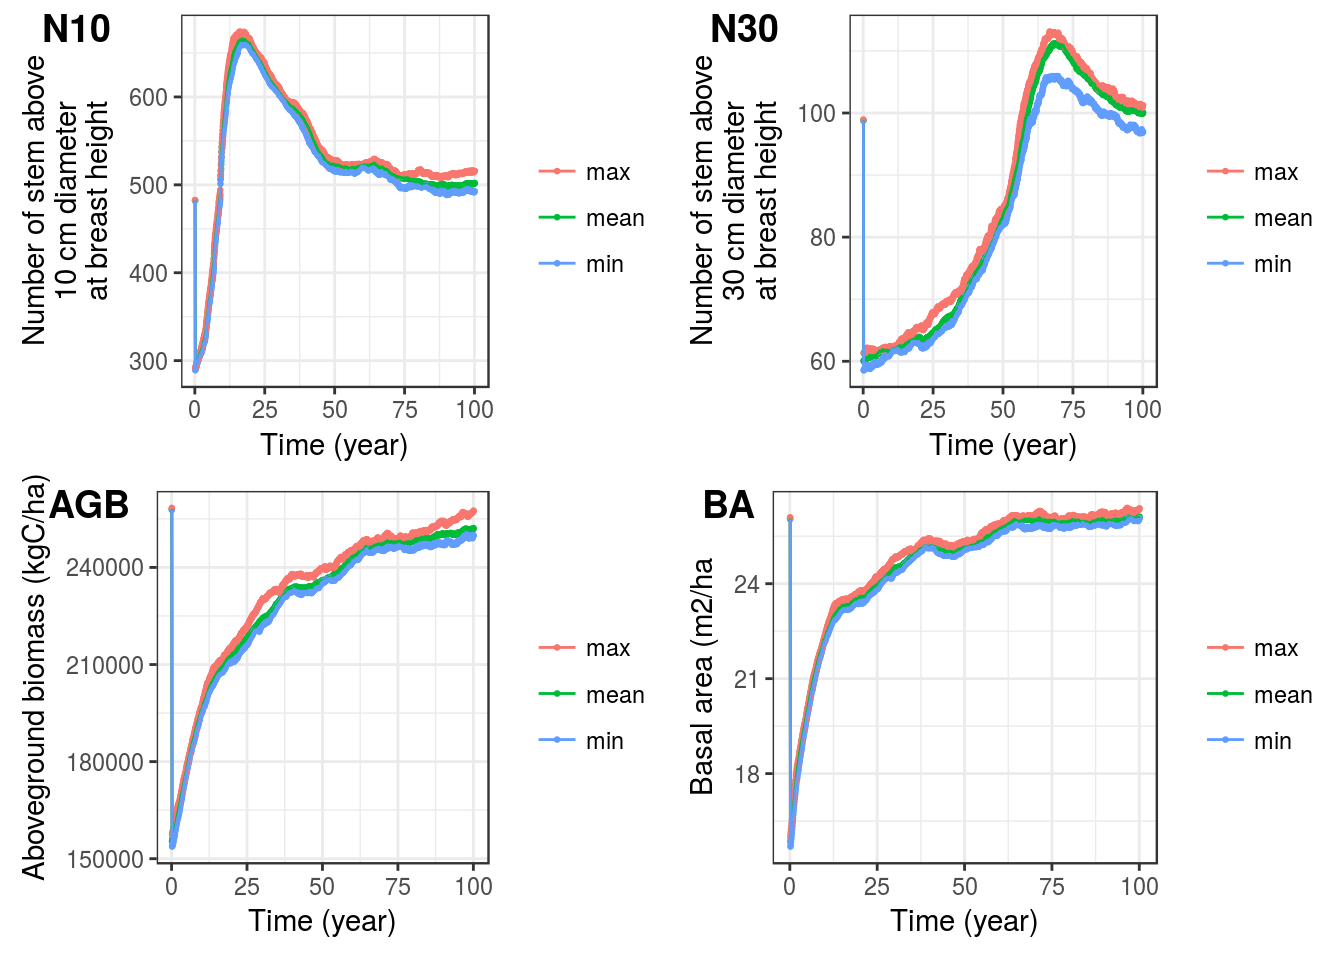
Figure D.3: Control replicates variation. Maximum, mean and minimum number of trees with dbh above 10 cm (N10) and 30 cm (N30), above ground biomass (AGB) and basal area (BA) over simulation time.
D.2.2 Functional traits
Most of functional traits had a significant long term influence on ecosystem outputs (figure D.4). Only seed volume was always in the range of variation of control replicates. On the other hand, few functional traits influenced final ecosystem structure (figure D.5). Only specific maximum diameter dmax add higher diversity for greater orders implying better evenness in species distributions. Regarding functional composition, traits fixed to mean did not change other functional traits density distribution.
ah-hmax traits fixed to mean increased number of stems above 10 and above 30 cm dbh and basal area after disturbance (but not in long term) and did not affect aboveground biomass. Similarly, wood specific gravity wsg trait fixed to mean had exactly the same effect on number of stems above 10 and above 30 cm dbh and basal area after disturbance than ah-hmax but with a time lag ; and wsg also increased aboveground biomass. dmax trait fixed to mean slightly decreased number of stems above 10 and above 30 cm dbh over time while it increased basal area, aboveground biomass, and species evenness. Finally, leaf mass per area LMA trait fixed to mean only decreased number of stem above 10 cm dbh after ecosystem resilience to disturbance (approximately 50 years) but did not affect other ecosystem outputs.
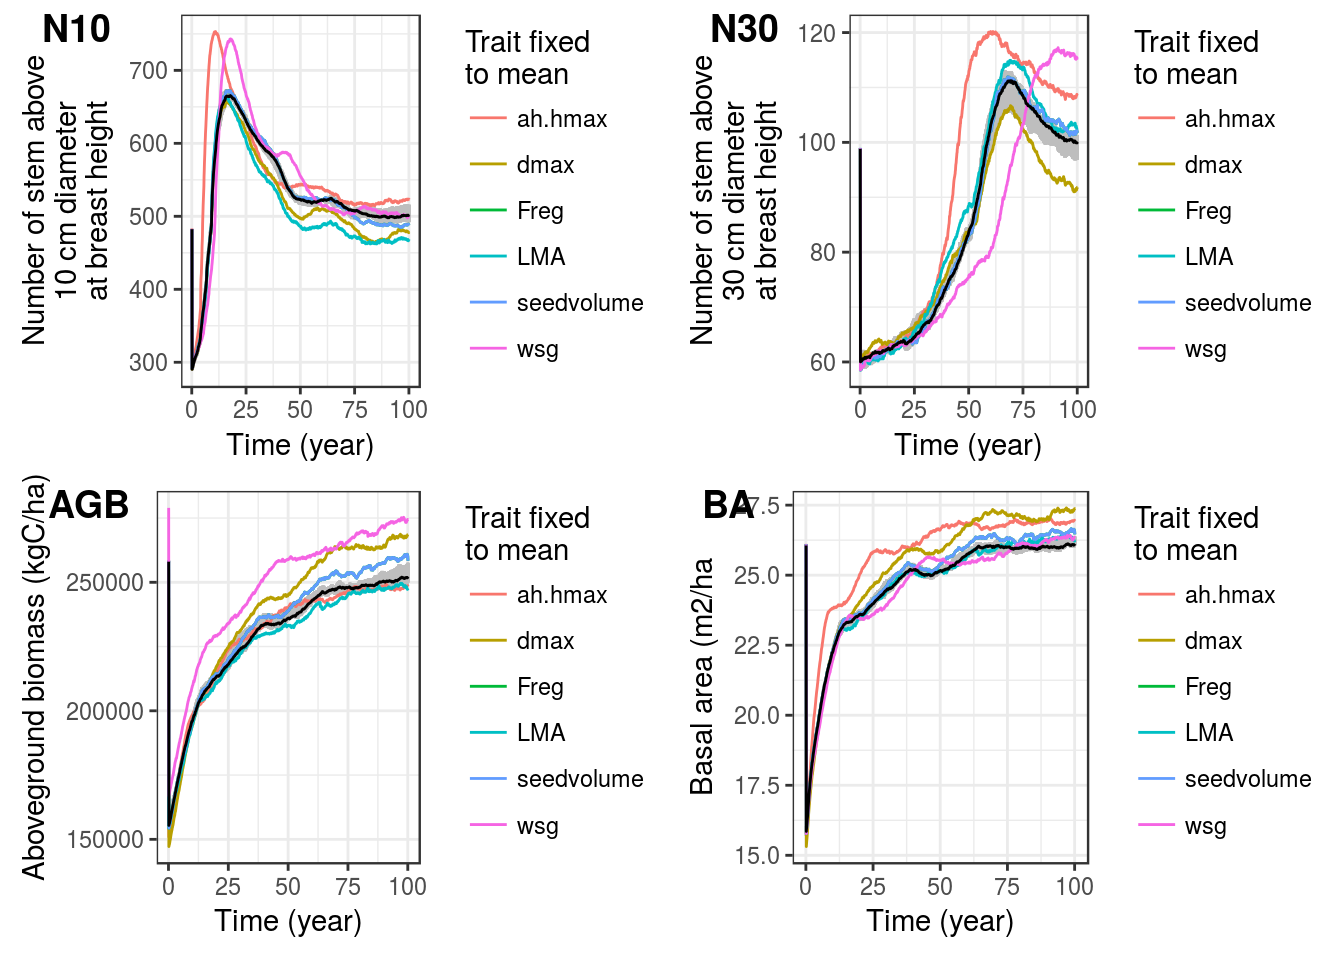
Figure D.4: Functional traits effect on simulation ecosystem variations over time. Number of trees with dbh above 10 cm (N10) and 30 cm (N30), above ground biomass (AGB) and basal area (BA). Grey area represents the interval of control replicates whereas black line represents the mean of control replicates.
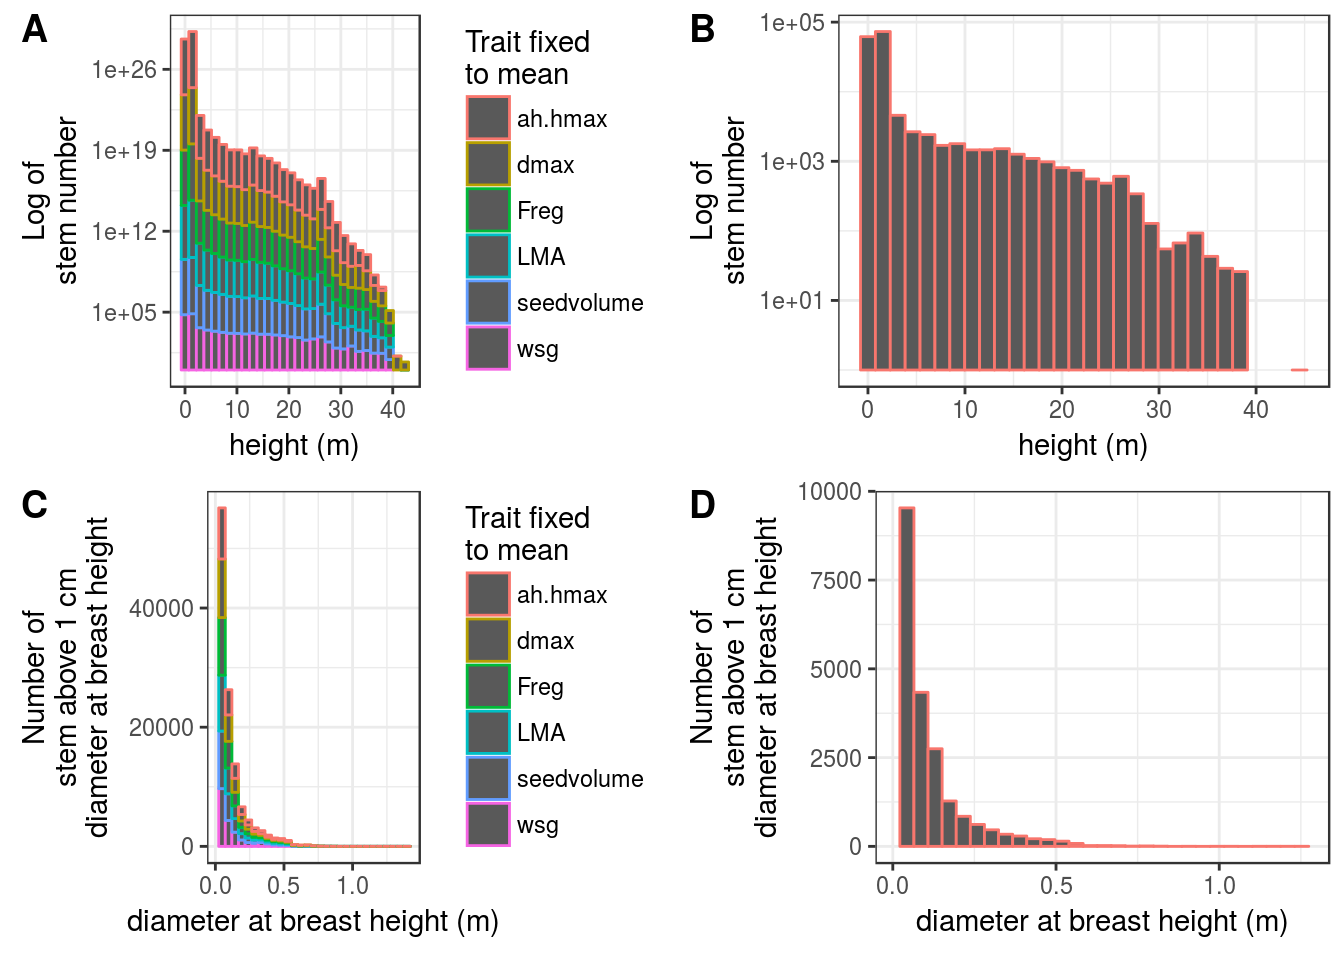
Figure D.5: Functional traits effect on simulation ecosystem final structure. Tree final height histogram for traits (A) and control (B), tree final diameter histogram for traits (C) and control (D), ecosystem final diversity plot at different orders (E), and ecosystem final rank-abundance diagram (F).
D.2.3 Seed rain
Seedrain constant affected ecosystem outputs only when set lower than default value (figure D.6 & D.7). Moreover, seedrain did not seem to affect aboveground biomass (figure D.6) and final ecosystem height and diameter structure (figure D.7). Seedrain constant fixed to 2 or 20 seed per hectare seemed to have a similar effect. Lower seedrain implied faster decrease of stem above 10 cm dbh and higher number of stem above 30 cm dbh after ecosystem resilience to disturbance (approximately 50 years). Lower seedrain than default decreased basal area over time. In addition, lower seedrain than default decreased equitability by increasing abundance of abundant species and decreasing abundance of less abundant species. Seedrain constant even decreased the total number of species when fixed to 2 seed per hectare. Finally, seedrain constant slightly affected functional composition with higher pike on ecosystem most representatives functional trait values. In a nutshell, the lower is the seedrain constant the most the functional density distribution is aggregated around few functional trait values.
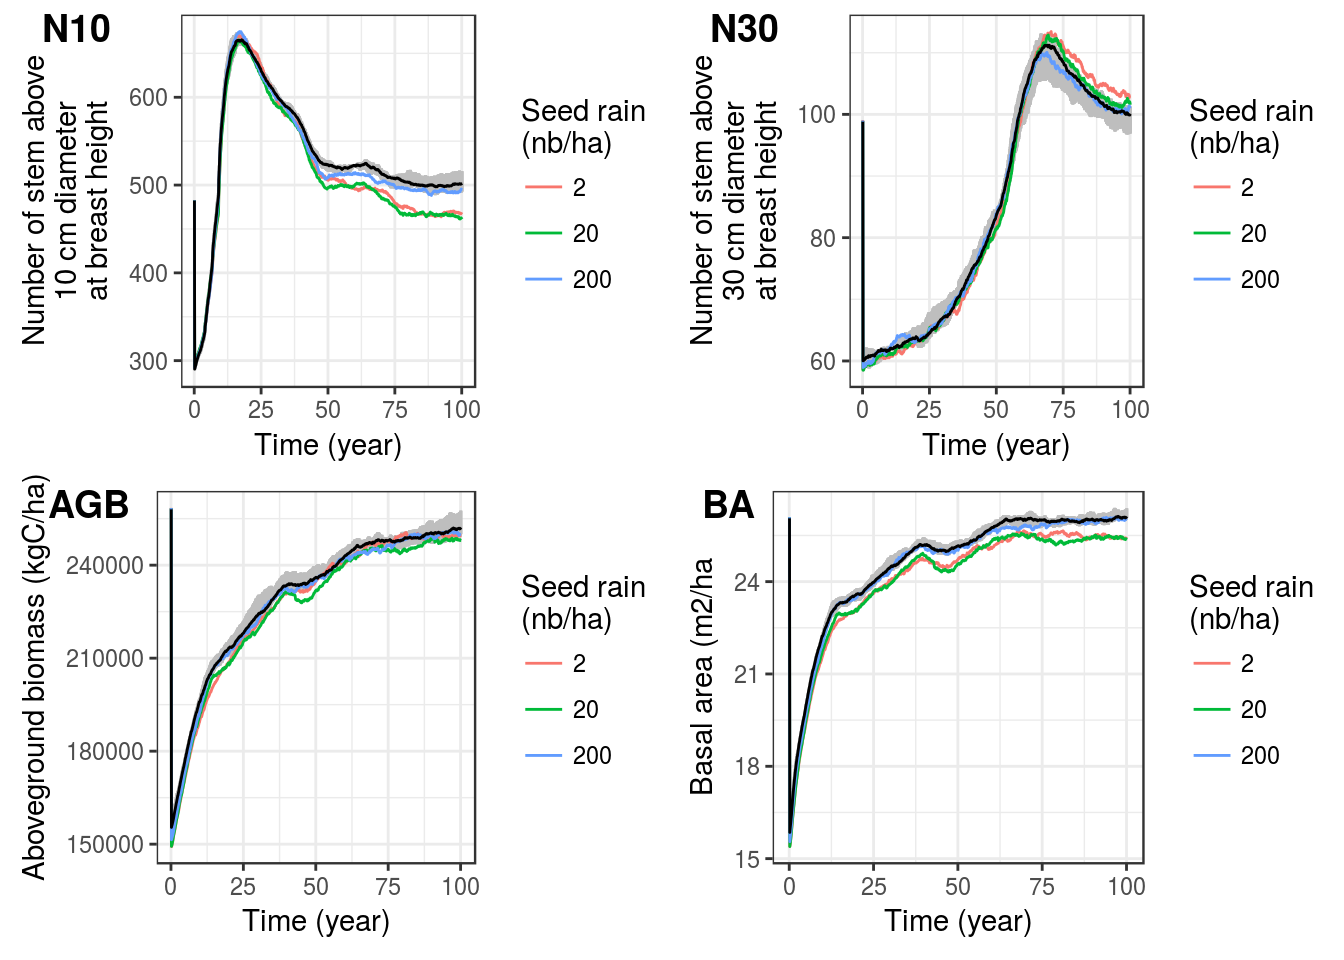
Figure D.6: Seed rain effect on simulation ecosystem variations over time. Number of trees with dbh above 10 cm (N10) and 30 cm (N30), above ground biomass (AGB) and basal area (BA). Grey area represents the interval of control replicates whereas black line represents the mean of control replicates.
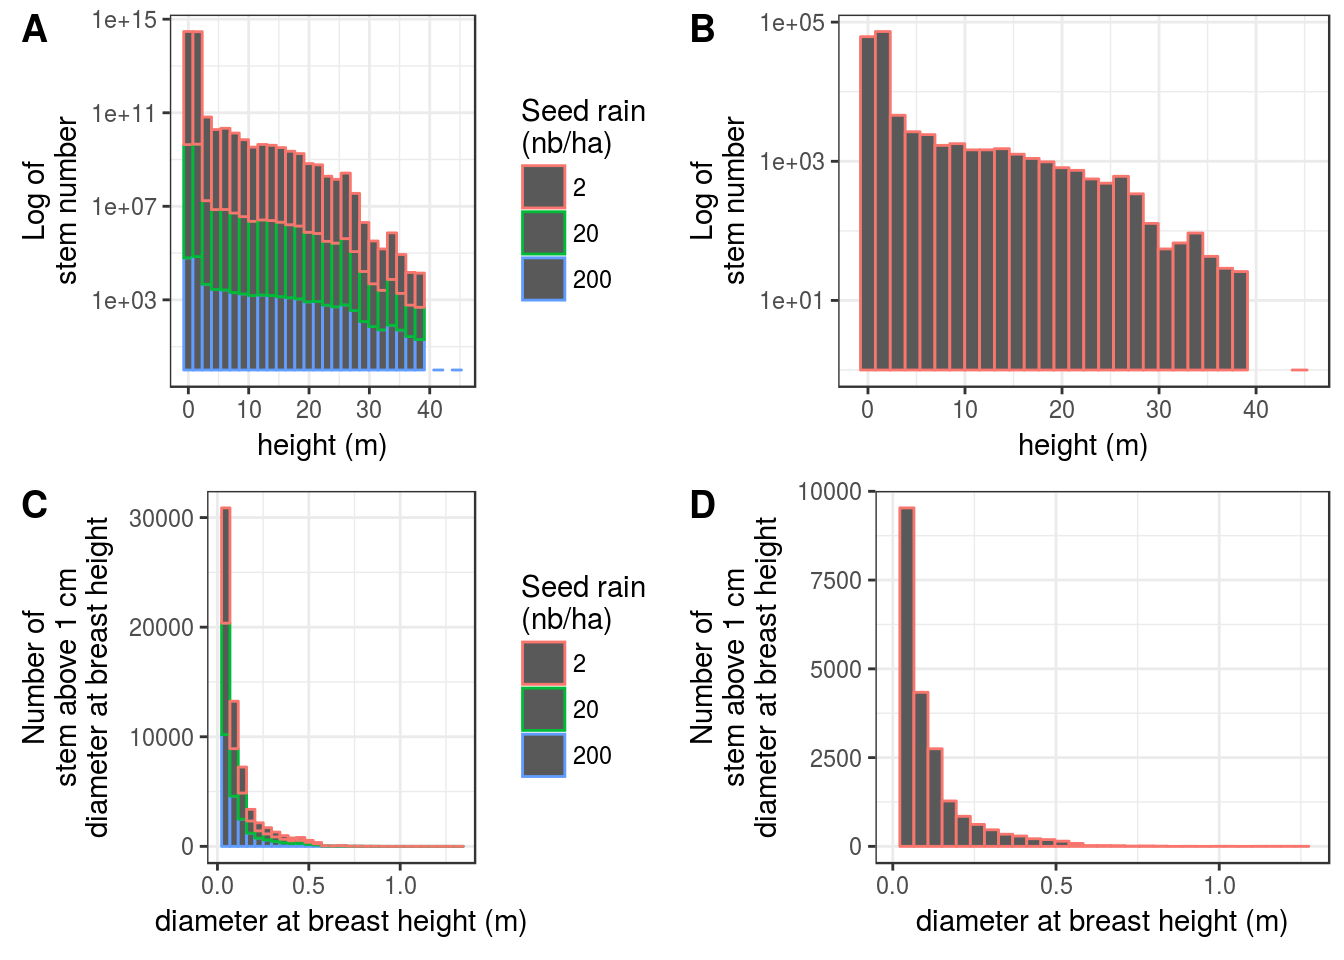
Figure D.7: Seed rain effect on simulation ecosystem final structure. Tree final height histogram for traits (A) and control (B), tree final diameter histogram for traits (C) and control (D).
D.3 Discussion
D.3.1 Disturbance simulation
Ecosystem structure, species organisation and functional composition stayed the same before and after disturbance. We can thus validate disturbance module in its actual state. Morevoer we can now consider that the composition we will initialise at the beginning of simulations will stay the same after disturbance. Finally control replicates has shown few stochasticity, it advocates for few or no replicates in further analysis.
D.3.2 Functional traits selection
ah-hmax fixed to mean implied no high or low trees. Less high trees left space for more trees increasing number of stems in the ecosystem thus increasing basal area. Wood specific gravity wsg fixed to mean mainly increased wood density of light wood species. Globally higher wood density increased lifespan of individuals responsible for the time lag and the higher number of stems increasing basal area. wsg fiwed to mean also increased carbon capture by individuals, thus increasing aboveground biomass. Specific maximum diameter dmax fixed to mean decreased death rates. Decreased death rate diminished number of stems, expecially big ones thus increasing global basal area and abiveground biomass. dmax fixed to mean by keeping more small diameter stems also increased random selection of species increasing evenness in species distribution. Considering the high correlation between ah and hmax we could also keep only hmax (because of its more straightforward ecological meaning).
D.3.3 Seed rain constant influence
Seedrain constant did not directly affect ecosystem global outputs over simulation post-disturbance time but have a major effect on species and functional composition and diversity. Reducing seedrain constant resulted in an ecosystem selecting few species increasing their abundance and functional dominance of their traits. Thus reduced seedrain constant greatly diminsihed evenness untill a decrease of total number of species for its lowest value.
References
Chave, J. (1999). Study of structural, successional and spatial patterns in tropical rain forests using TROLL, a spatially explicit forest model. Ecological Modelling, 124, 233–254.