3 Results
3.1 Sensitivity
Most of functional traits had a significant long term influence on ecosystem outputs (figure 3.1). Only specific maximum diameter dmax add higher diversity for greater orders implying better evenness in species distributions. Regarding functional composition, traits fixed to mean did not change other functional traits density distribution. Moreover, seedrain did not seem to affect aboveground biomass and final ecosystem height and diameter structure. Seedrain constant fixed to 2 or 20 seed per hectare seemed to have a similar effect. Lower seedrain implied faster decrease of stem above 10 cm dbh and higher number of stem above 30 cm diameter at breast height after ecosystem resilience to disturbance (approximately 50 years). Lower seedrain than default decreased basal area over time. In addition, lower seedrain than default decreased equitability by increasing abundance of abundant species and decreasing abundance of less abundant species. See Appendix 4: Sensitivity analysis for further details.
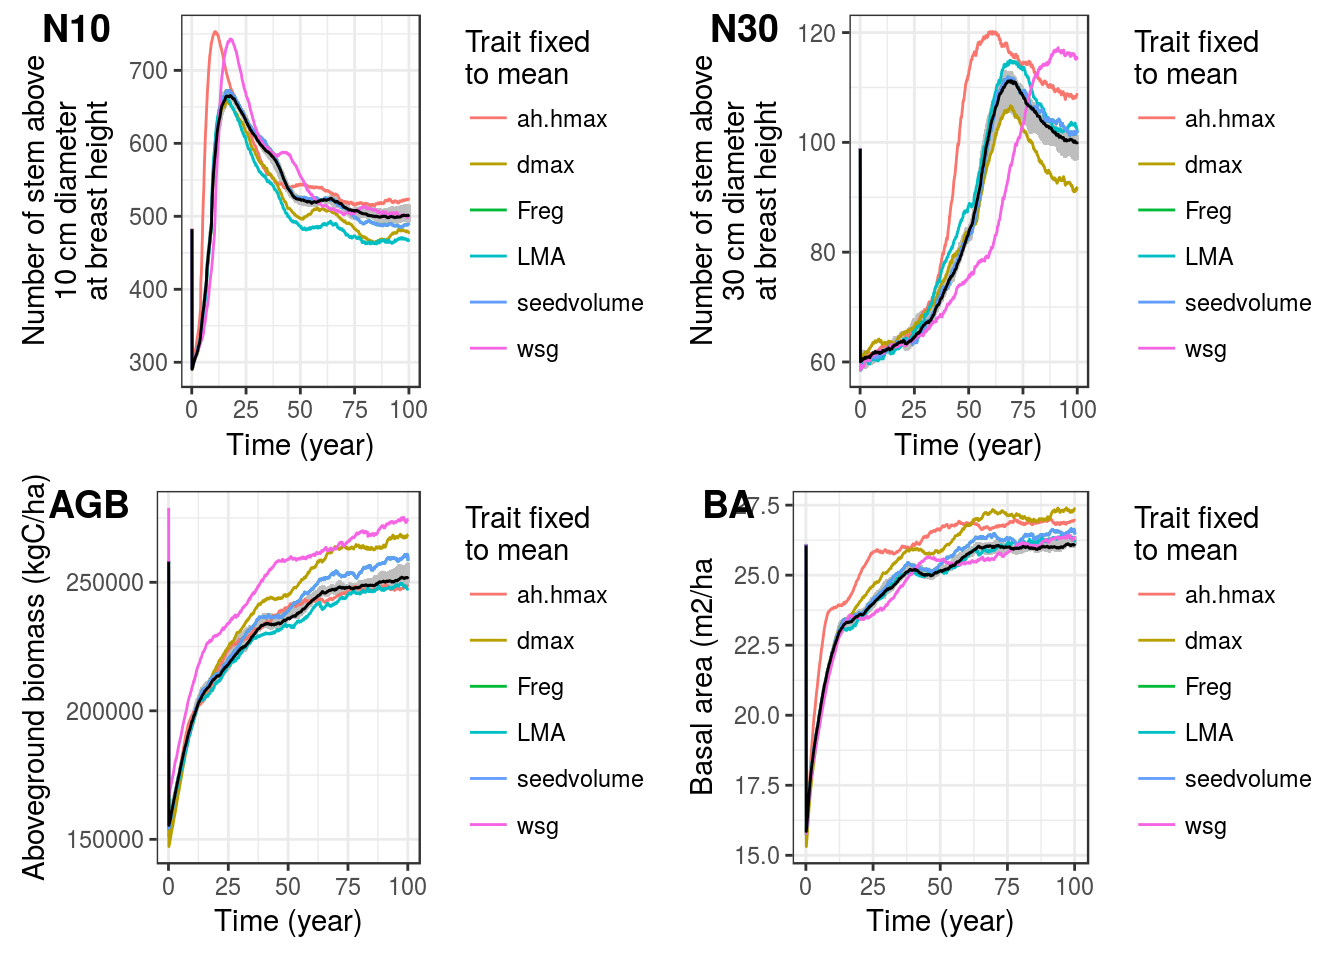
Figure 3.1: Functional traits effect on simulation ecosystem variations over time. Number of trees with dbh above 10 cm (N10) and 30 cm (N30), above ground biomass (AGB) and basal area (BA). Sensitivity of model to functional traits was performed by fixing species trait values to their mean. Grey area represents the interval of control replicates whereas black line represents the mean of control replicates, thus if ecosystems outputs are outside of grey area values the studied parameter is considered to have a significant influence on the model.
3.2 Disturbance
3.2.1 Ecosystem functions
We transformed all ecosystem outputs from the 240 disturbance simulations in resilience metrics normalizing the treatment values by their corresponding control (Figure 3.2 A et B). We then gathered ecosystem outputs by main ecosystem functions (forest dynamic and forest production) to compute ecosystem distance to equilibrium (Figure 3.2 C). Finally, we integrated distance to equilibrium in a cummulative sum over time (Figure 3.2 D).
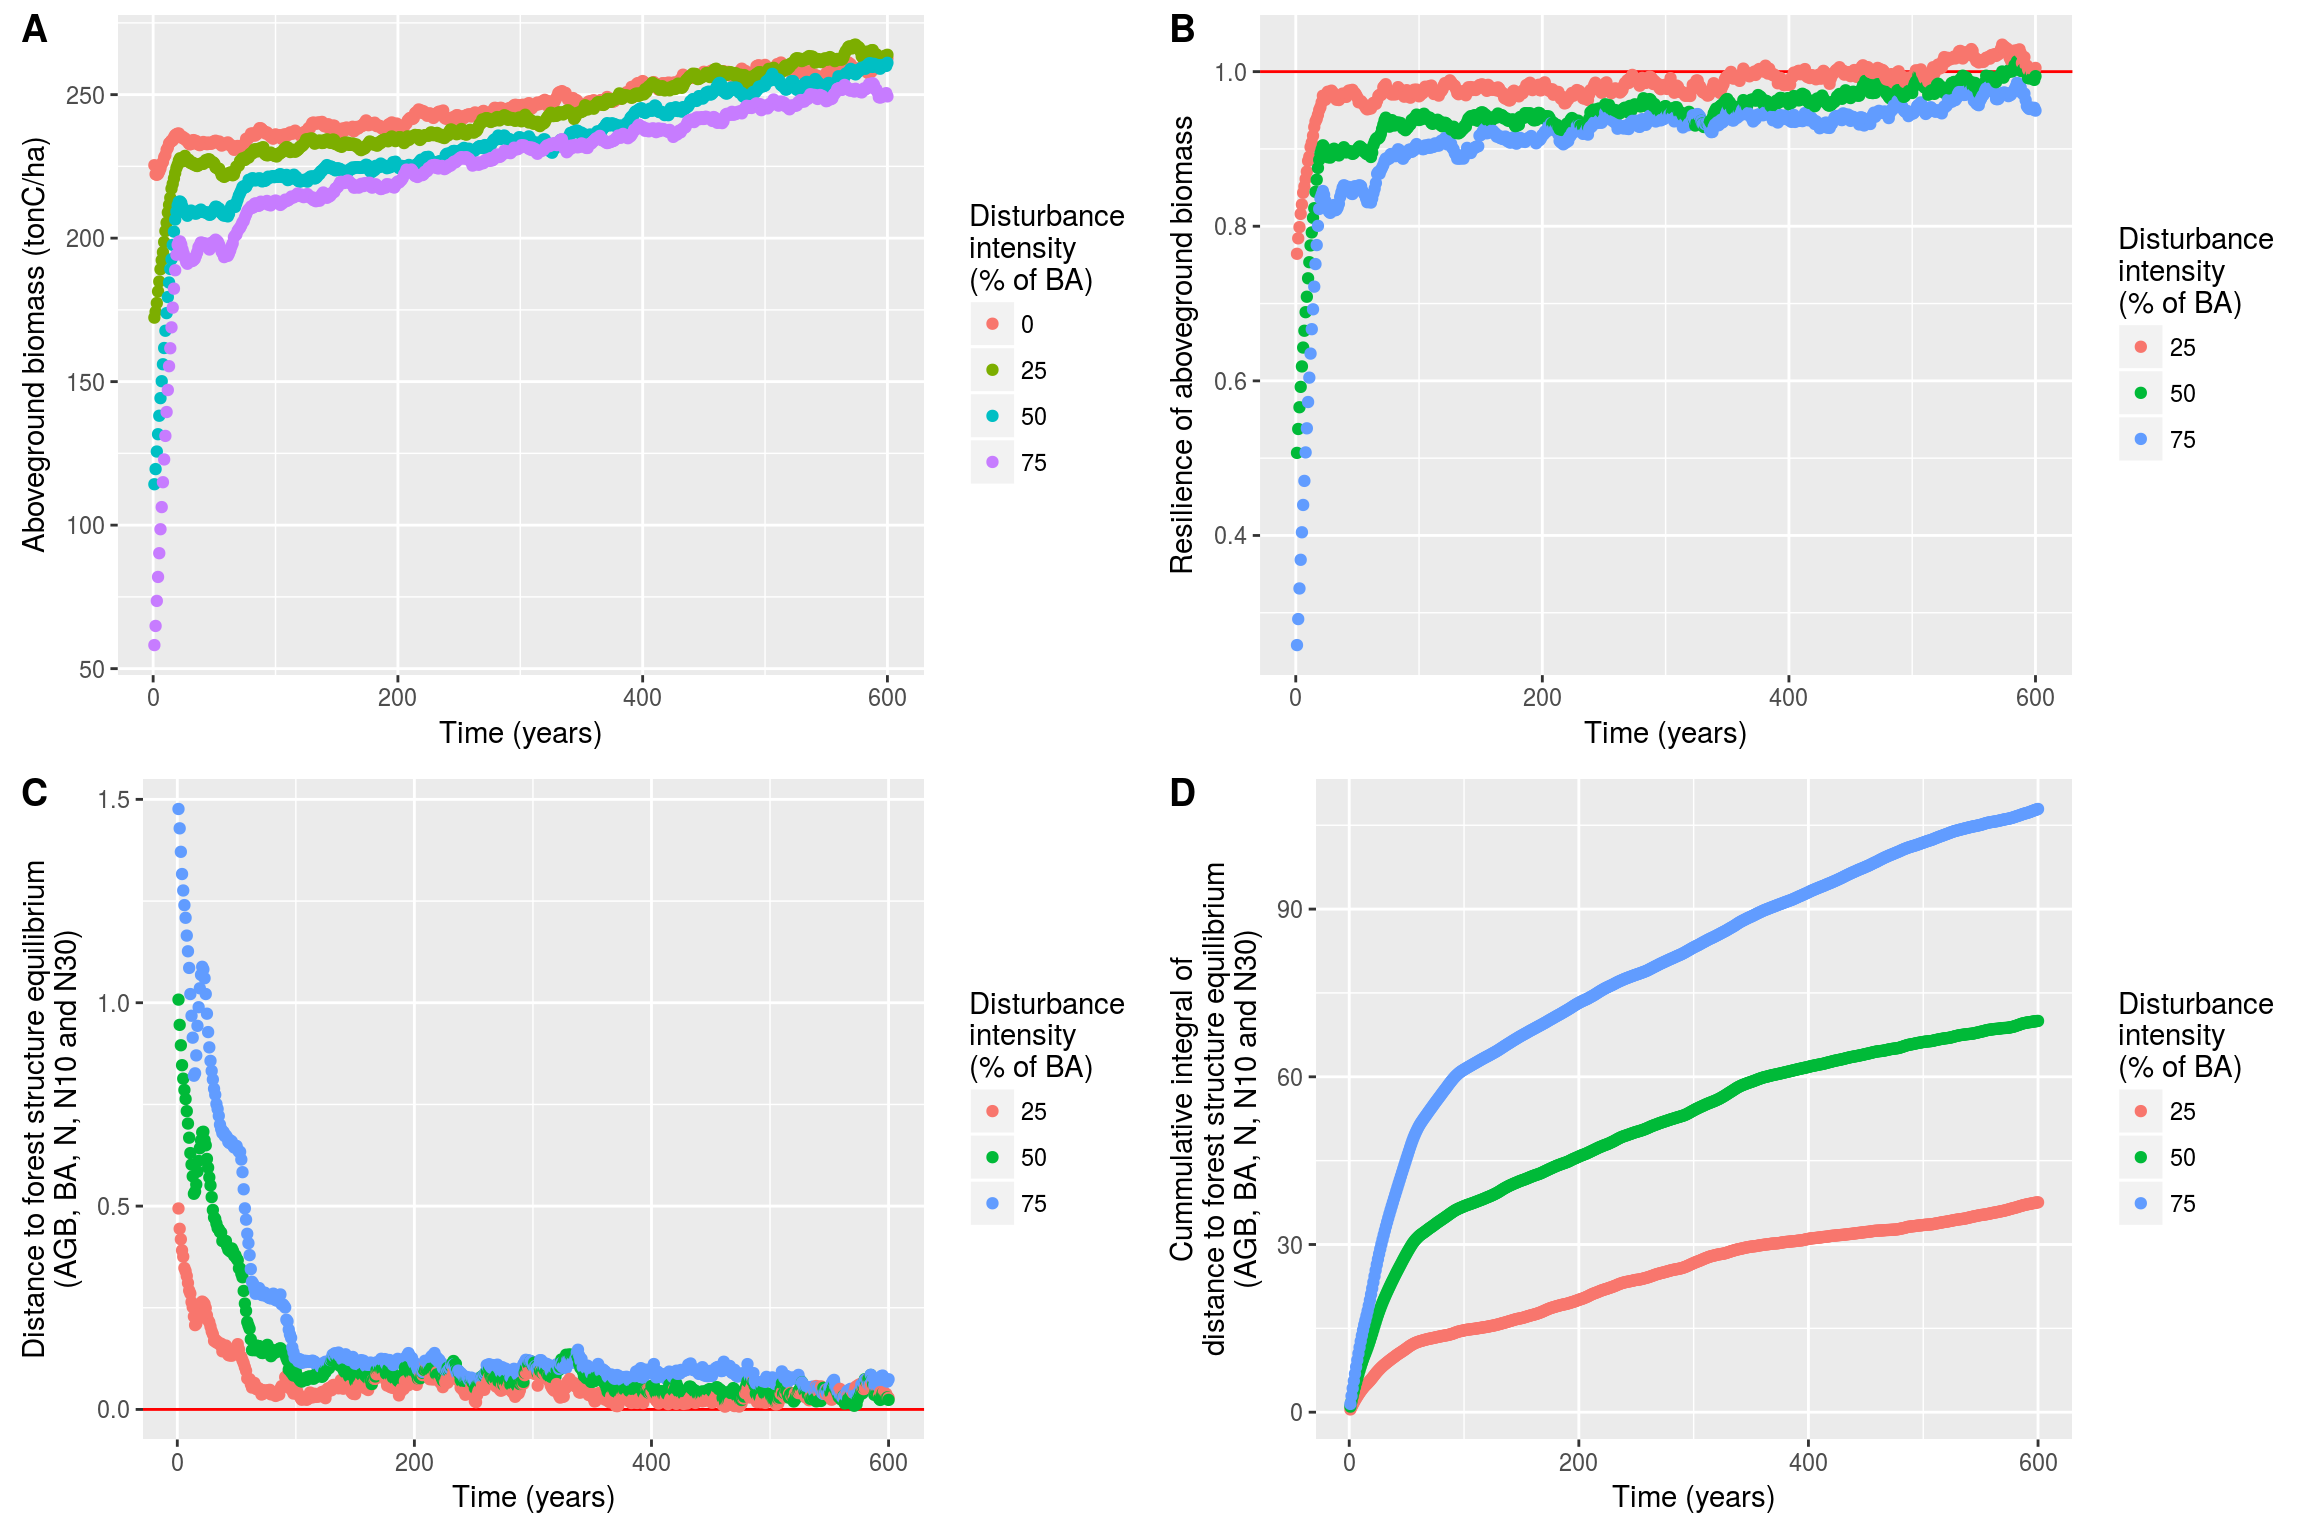
Figure 3.2: Ecosystem outputs data transformation. Ecosystem outputs (A) are normalized by the control value over time to calculate resilience (B); resilience of different ecosystem outputs is then used in a multidimensional space to caluclate ecosystem distance to equilibrium (C); finally distance ot equilibirum is integrated over time in a cummulative sum (D).
The ranking was stable over time for the 240 simulations. So we used the cummulative integral after 600 years \(Ieq_{600}\) as a measurement of ecosystem resilience. We compared cummulative integral after 600 years to communities taxonomic and functional diversity for each leavel of disturbance (see Figure 3.3). We found that increased functional diversity (FDiv, Villéger et al. 2008) was reducing cummulative integral from ecosystem distance to forest structure equilibrium after 600 years (\(Ieq_{600}\)). In addition, functional evenness was complementary reducing \(Ieq_{600}\). Finally species richness was not directly link to \(Ieq_{600}\). Effectivelly, low species richness could result in variant \(Ieq_{600}\), but increased species richness resulted in increased functional diversity and consequently lower \(Ieq_{600}\). We found similar results for all disturbance levels and forest functionning (see Appendix 5: Disturbance simulations).
![Ecosystem resilience after 600 years with taxonomic and functional diversity for different levels of disturbance. Cummulative integral from ecosystem distance to forest structure equilibrium after 600 years was represented against functional diversity [FDiv, @villeger_new_2008] for different level of disturbance (25, 50 and 75% of total basal area); dot shapes represents the species richness whereas dot color represents functional evenness [FEve, @villeger_new_2008].](master-thesis_files/figure-html/gIeq-1.png)
Figure 3.3: Ecosystem resilience after 600 years with taxonomic and functional diversity for different levels of disturbance. Cummulative integral from ecosystem distance to forest structure equilibrium after 600 years was represented against functional diversity (FDiv, Villéger et al. 2008) for different level of disturbance (25, 50 and 75% of total basal area); dot shapes represents the species richness whereas dot color represents functional evenness (FEve, Villéger et al. 2008).
3.2.2 Biodiversity effect
We measured all ecosystem outputs biodiversity net effect in disturbance simulations by comparing them to their species corresponding monoculture simulations. The net effect was then partition between selection and complementarity effect. We normalized complementarity and selection effect of disturbed simulations by biodiversity net effect of undisturbed control simulation (see Table 3.1) to measure the resilience to disturbance of their aboveground biomass (see Figure 3.4). We found that complementarity effect was recovering biodiversity net effect and was stronger than selection effect in the first decades. But after few decades the complementarity effect diminsihed toward a low value. On the contrary selection effect was reduced or even removed by the disturbance. It increased during the whole simulation and was greater than complementarity effect only after decades. The time lag for which complementarity effect was greater than selection effect was increasing with disturbance intensity. Finally 600 years after the disturbance event biodiversity net effect was still not recovered for a disturbance intensity greater than 25% of basal area. We obtained those results for aboveground biomass. We found similar results but with an amplified signal for basal area (\(BA\)) and stem abundance (\(N\) but with an inverted signal because of the forest self thinning) (see Appendix 5: Disturbance simulations). Finally, forest growth primary productivity (\(GPP\)) recovered in few years (proportionnaly to disturbance), and its net effect was maintained by complementarity effect (see Appendix 5: Disturbance simulations).
| variable | mean | standard deviation | name | unit |
|---|---|---|---|---|
| agb | 32.721 | 17.839 | aboveground biomass | \(tonC.ha^{-1}\) |
| ba | 1.633 | 0.743 | basal area | \(m^2.ha^{-1}\) |
| n | 103.880 | 231.623 | number of stems | \(n.ha^{-1}\) |
| n10 | -6.815 | 13.003 | number of stems above 10cm dbh | \(n.ha^{-1}\) |
| gpp | 0.147 | 0.047 | growth primary production | \(MgC.ha^{-1}\) |
| npp | -0.041 | 0.036 | net primary production | \(MgC.ha^{-1}\) |
| Rday | 0.046 | 0.018 | autotrophic respiration during day | \(MgC.ha^{-1}\) |
| Rnight | 0.074 | 0.030 | autotrophic respiration during night | \(MgC.ha^{-1}\) |
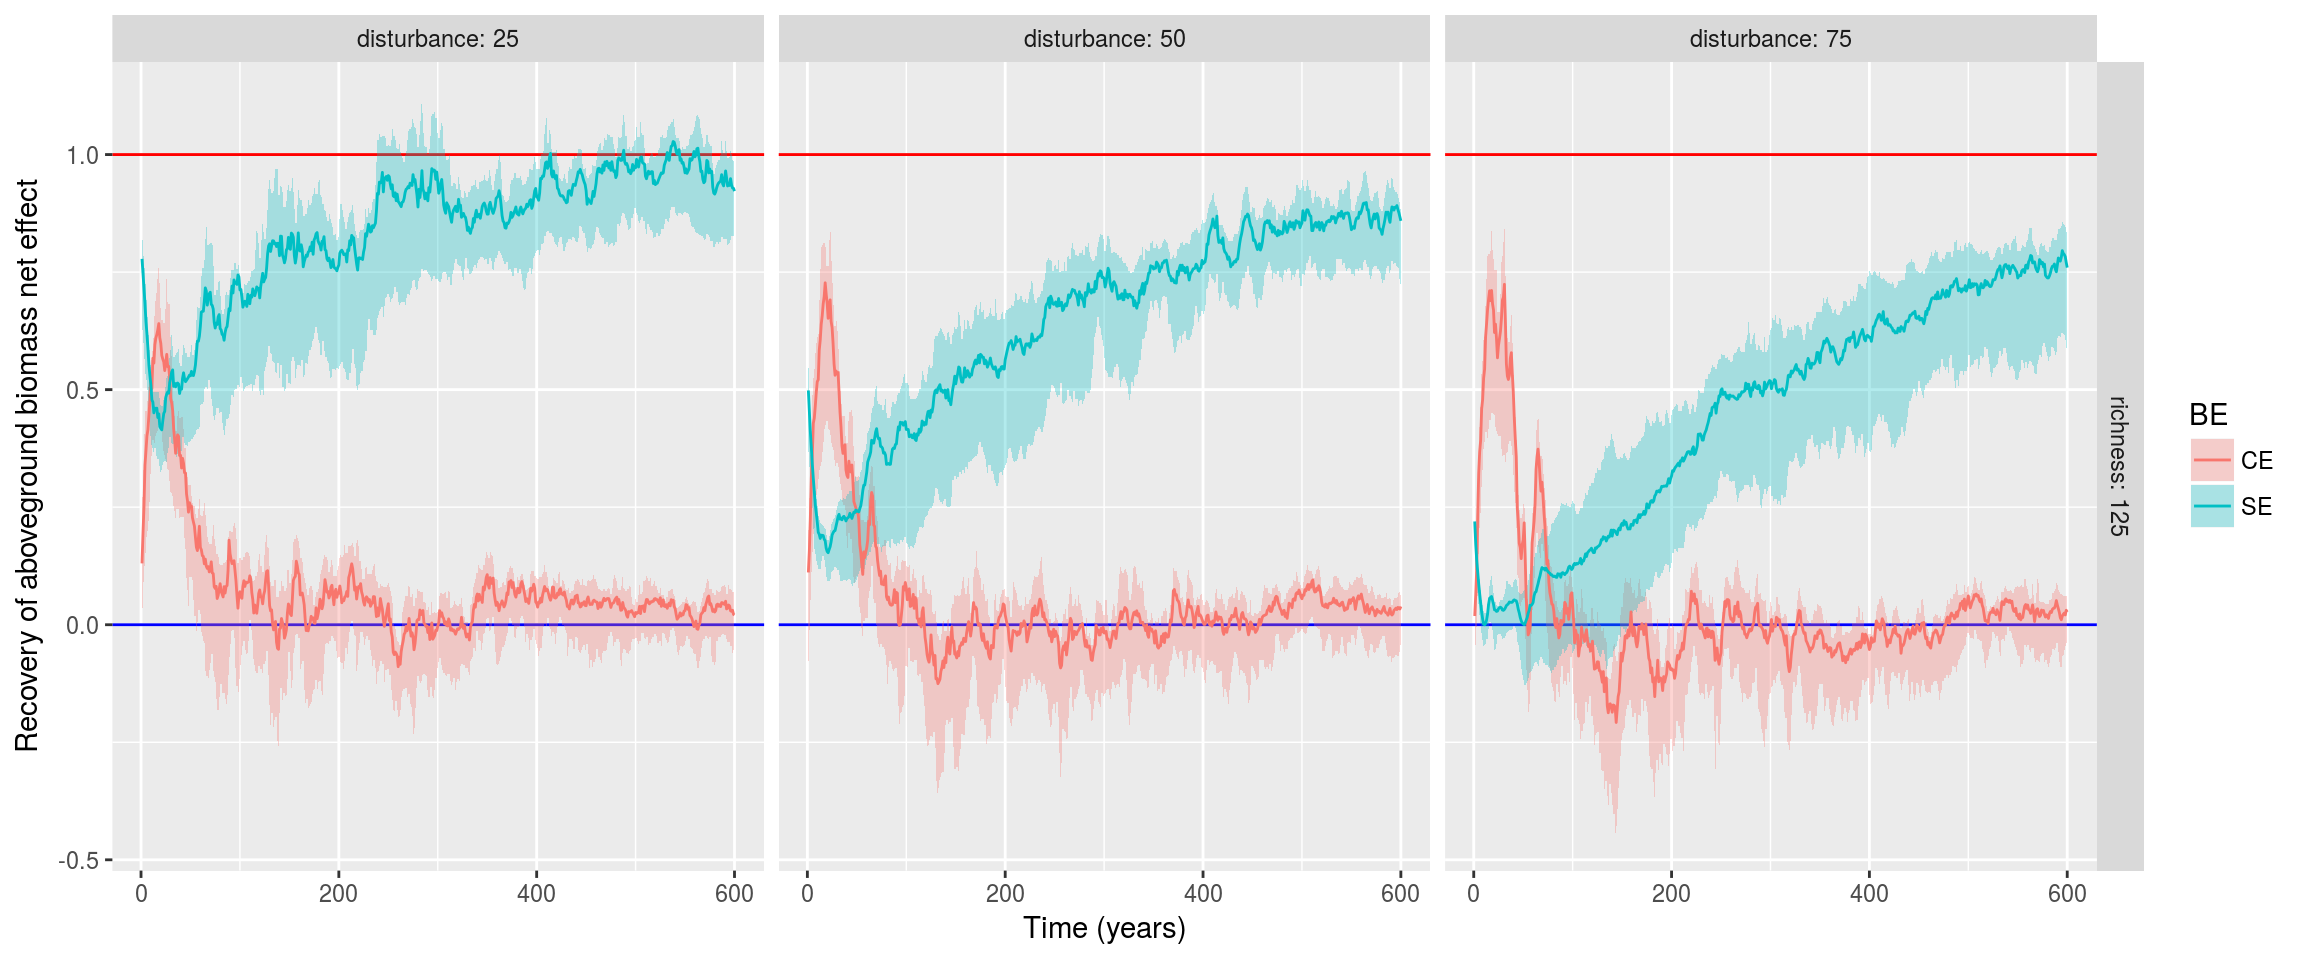
Figure 3.4: Resilience of complementarity and selection effects. Complementarity effect (CE) and selection effect (SE) where normalized by control net effect (NEc), thus measuring their resilience over time.
3.3 Sylviculture
We repeated design of experiments and simulations used for the disturbance simulations with the sylviculture module. But only 37 simulations included harvestable species. Moreover most of simulations included low harvestable volume resulting in a small disturbance from 0.5 to 2.0 \(m^2.ha^{-1}\) (see Figure 3.5). Consequently most of disturbed volume was due to primary and secondary tracks and was not related to logged trees. Thus sylviculture module resulted in aggregated localized gaps but not in species selective disturbance. We found that, contrarily to previous results, functional richness was significantly (\(p<0.01\)) decreasing forest resilience see Figure 3.5). But the range of variation from resilience was really low (\(2 < I_{eq_{600}} < 10\)). And resilience was mainly due to the density of Bocoa prouacensis in the simulated mature forests. Effectively Bocoa prouacensis was often the main harvested species and possessed additionnally a quick recovery inside the model due to unrealisticaly advantageous parameters. Still we found that functional dispersion was decreasing resilience but not significantly (see Appendix 6: Sylviculture simulations). Finally, biodiversity net effect is almost undisturbed due to the low disturbance intensity from the sylviculture module and results did not show complementarity or selection effect in forest resilience (see Appendix 6: Sylviculture simulations).
![Ecosystem resilience after 600 years with taxonomic and functional diversity. Cummulative integral from ecosystem distance to forest structure equilibrium after 600 years normalized by disturbed basal area was represented against functional richness [FRic, @villeger_new_2008]. Dot color represents the species richness (nb) whereas dot size represents the disturbed basal area (m2/ha). Grey line represents the linear regression and grey area the confidence interval.](master-thesis_files/figure-html/gIeqSylv-1.png)
Figure 3.5: Ecosystem resilience after 600 years with taxonomic and functional diversity. Cummulative integral from ecosystem distance to forest structure equilibrium after 600 years normalized by disturbed basal area was represented against functional richness (FRic, Villéger et al. 2008). Dot color represents the species richness (nb) whereas dot size represents the disturbed basal area (m2/ha). Grey line represents the linear regression and grey area the confidence interval.
References
Villéger, S., Mason, N.W.H. & Mouillot, D. (2008). New multidimensional functional diversity indices for a multifaceted framework in functional ecology. Ecology, 89, 2290–2301.