E Appendix 5: Disturbance simulations
E.1 Ecosystem functions
This appendix presents ecosystem resilience after 600 years with taxonomic and functional diversity for different levels of disturbance. It encompass all functionnal diversity components (FRIC, FEve, FDiv, and FDis, Villéger et al. 2008). And it presents results for both forest structure (Figure E.1) and forest functionning (Figure E.2).
![Ecosystem resilience after 600 years with taxonomic and functional diversity for different levels of disturbance. Cummulative integral from ecosystem distance to forest structure equilibrium after 600 years was represented against functional diversity [FRIC, FEve, FDiv, and FDis, @villeger_new_2008] for different level of disturbance (25, 50 and 75% of total basal area); dot shapes represents the species richness.](master-thesis_files/figure-html/A5IeqStructureAll-1.png)
Figure E.1: Ecosystem resilience after 600 years with taxonomic and functional diversity for different levels of disturbance. Cummulative integral from ecosystem distance to forest structure equilibrium after 600 years was represented against functional diversity (FRIC, FEve, FDiv, and FDis, Villéger et al. 2008) for different level of disturbance (25, 50 and 75% of total basal area); dot shapes represents the species richness.
![Ecosystem resilience after 600 years with taxonomic and functional diversity for different levels of disturbance. Cummulative integral from ecosystem distance to forest functionning equilibrium after 600 years was represented against functional diversity [FRIC, FEve, FDiv, and FDis, @villeger_new_2008] for different level of disturbance (25, 50 and 75% of total basal area); dot shapes represents the species richness.](master-thesis_files/figure-html/A5IeqProductionAll-1.png)
Figure E.2: Ecosystem resilience after 600 years with taxonomic and functional diversity for different levels of disturbance. Cummulative integral from ecosystem distance to forest functionning equilibrium after 600 years was represented against functional diversity (FRIC, FEve, FDiv, and FDis, Villéger et al. 2008) for different level of disturbance (25, 50 and 75% of total basal area); dot shapes represents the species richness.
E.2 Biodiversity effect
Figure E.3 presents the resilience of complementarity and selection effects for different ecosystem metrics (AGB, BA, N, GPP and NPP).
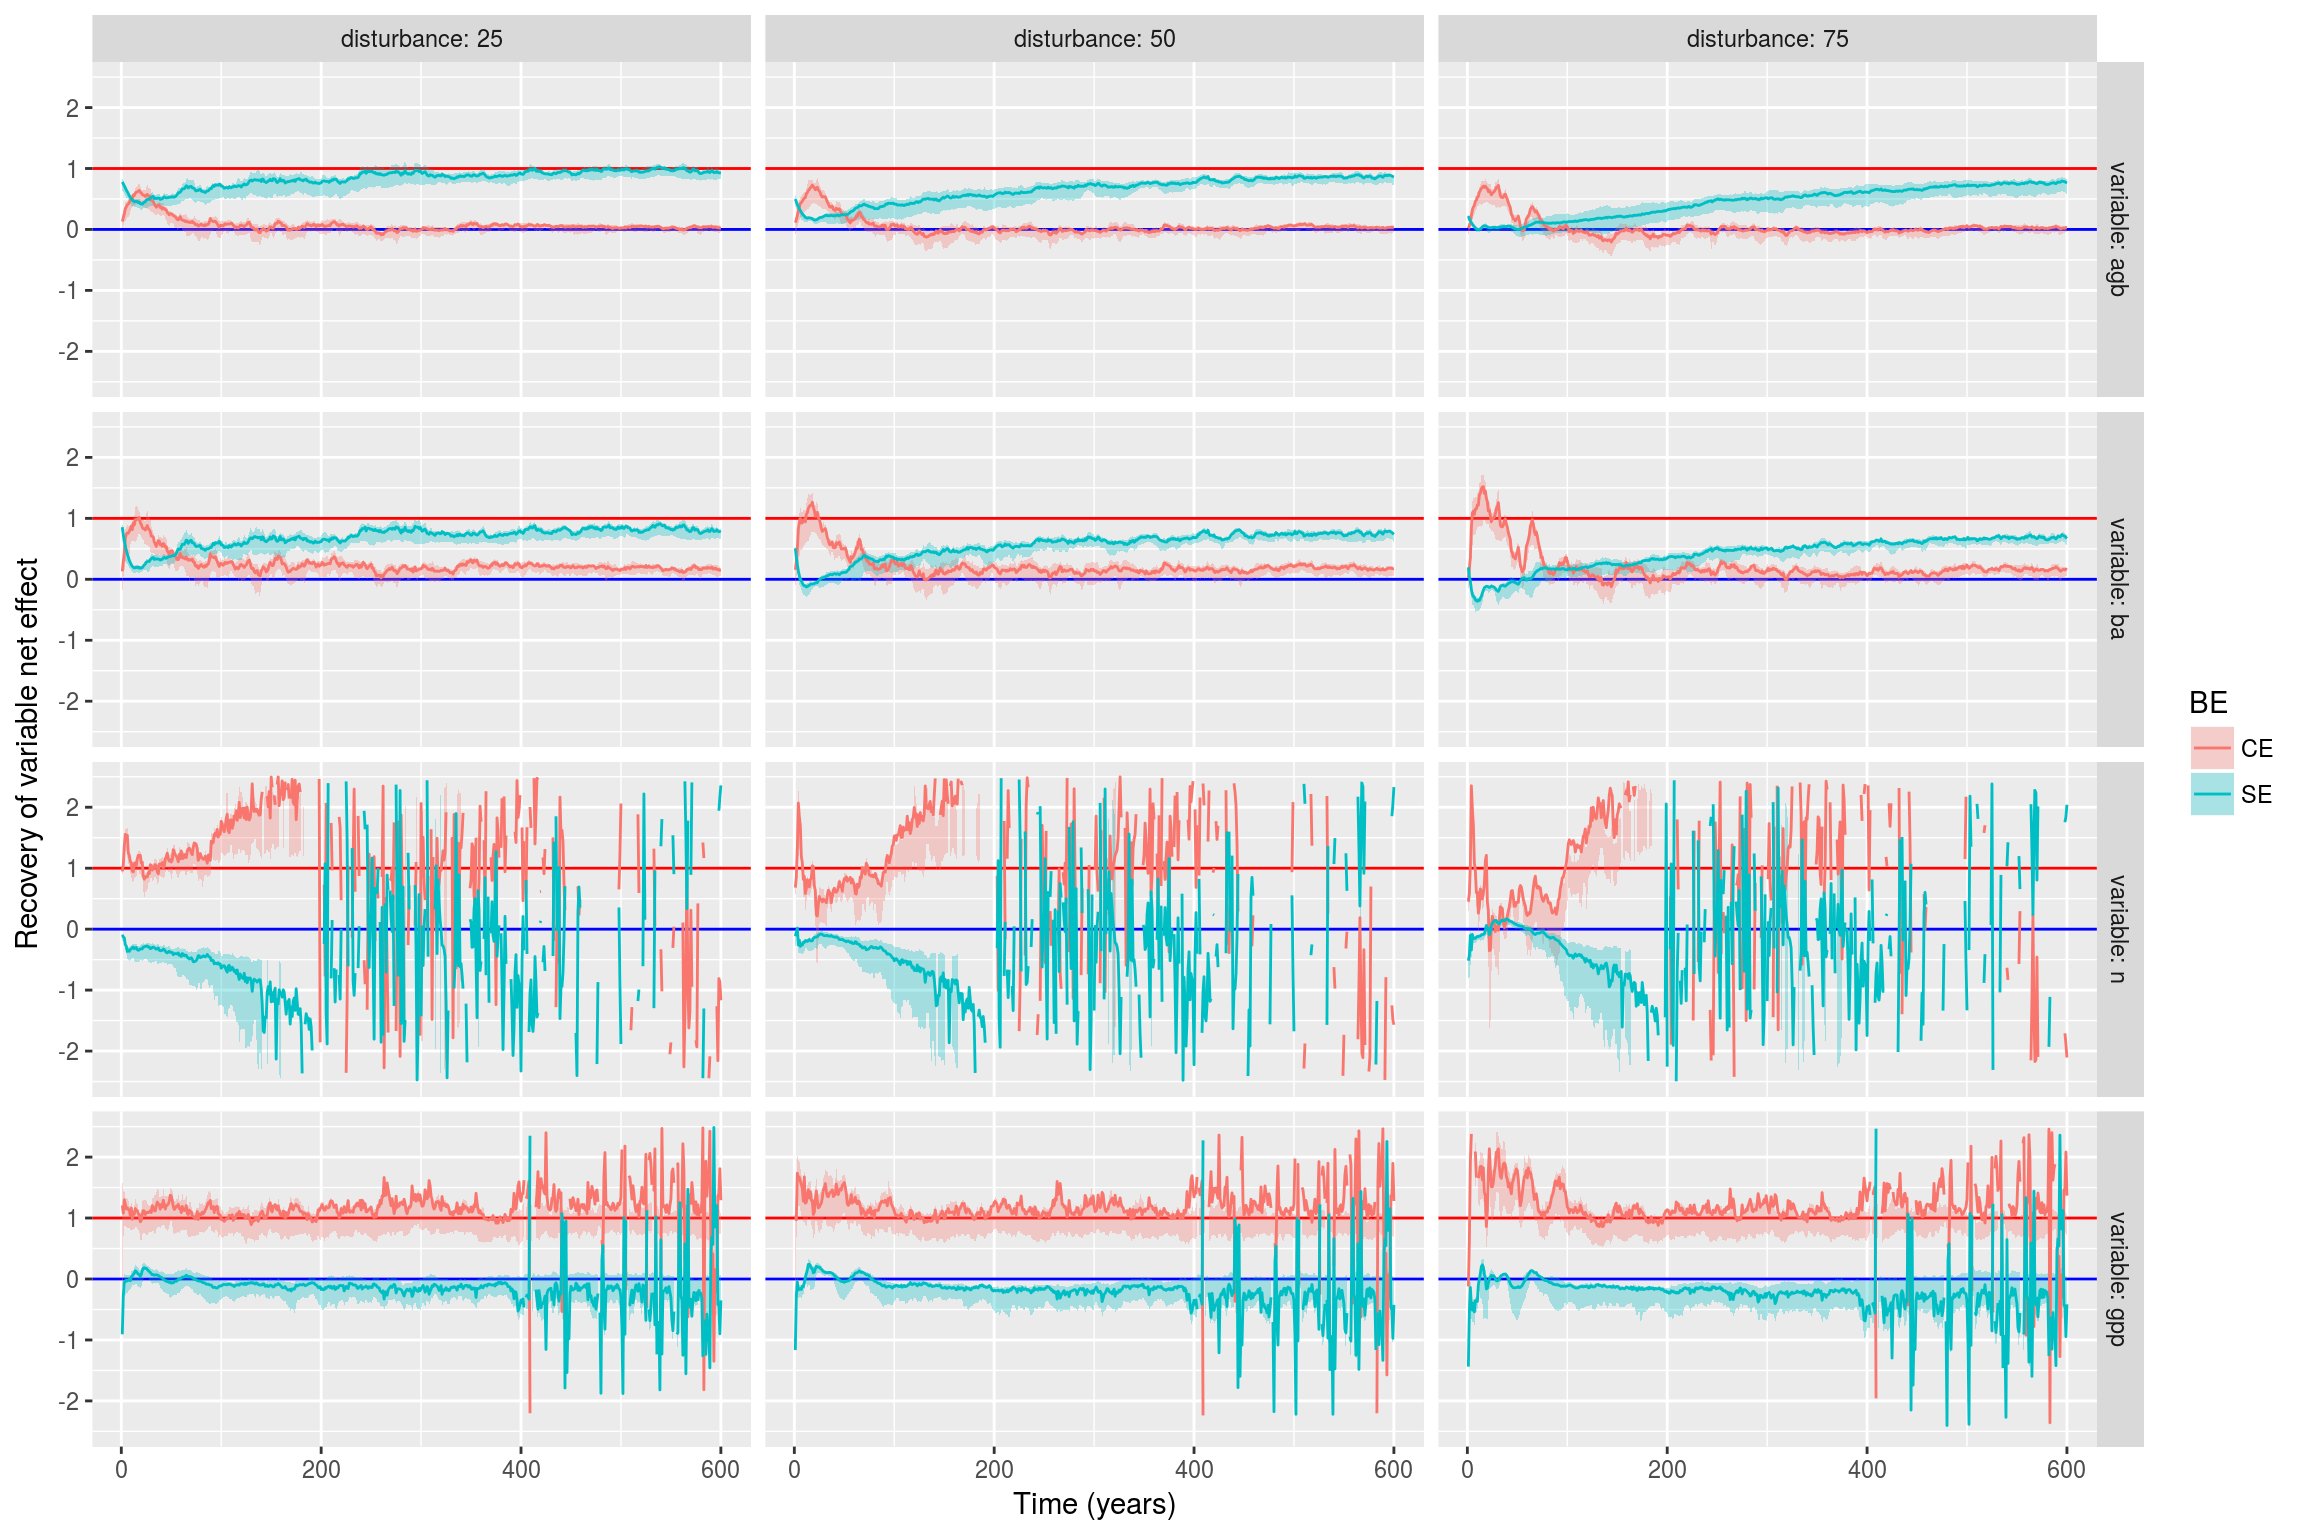
Figure E.3: Resilience of complementarity and selection effects. Complementarity effect (CE) and selection effect (SE) where normalized by control net effect (NEc), thus measuring their resilience over time for different ecosystem variables (AGB, BA, N, GPP).
References
Villéger, S., Mason, N.W.H. & Mouillot, D. (2008). New multidimensional functional diversity indices for a multifaceted framework in functional ecology. Ecology, 89, 2290–2301.