Chapter 15 Manuscript figures EVS
This chapter develop the code for figure preparation for the final manuscript.
15.2 Figure 3 EVS
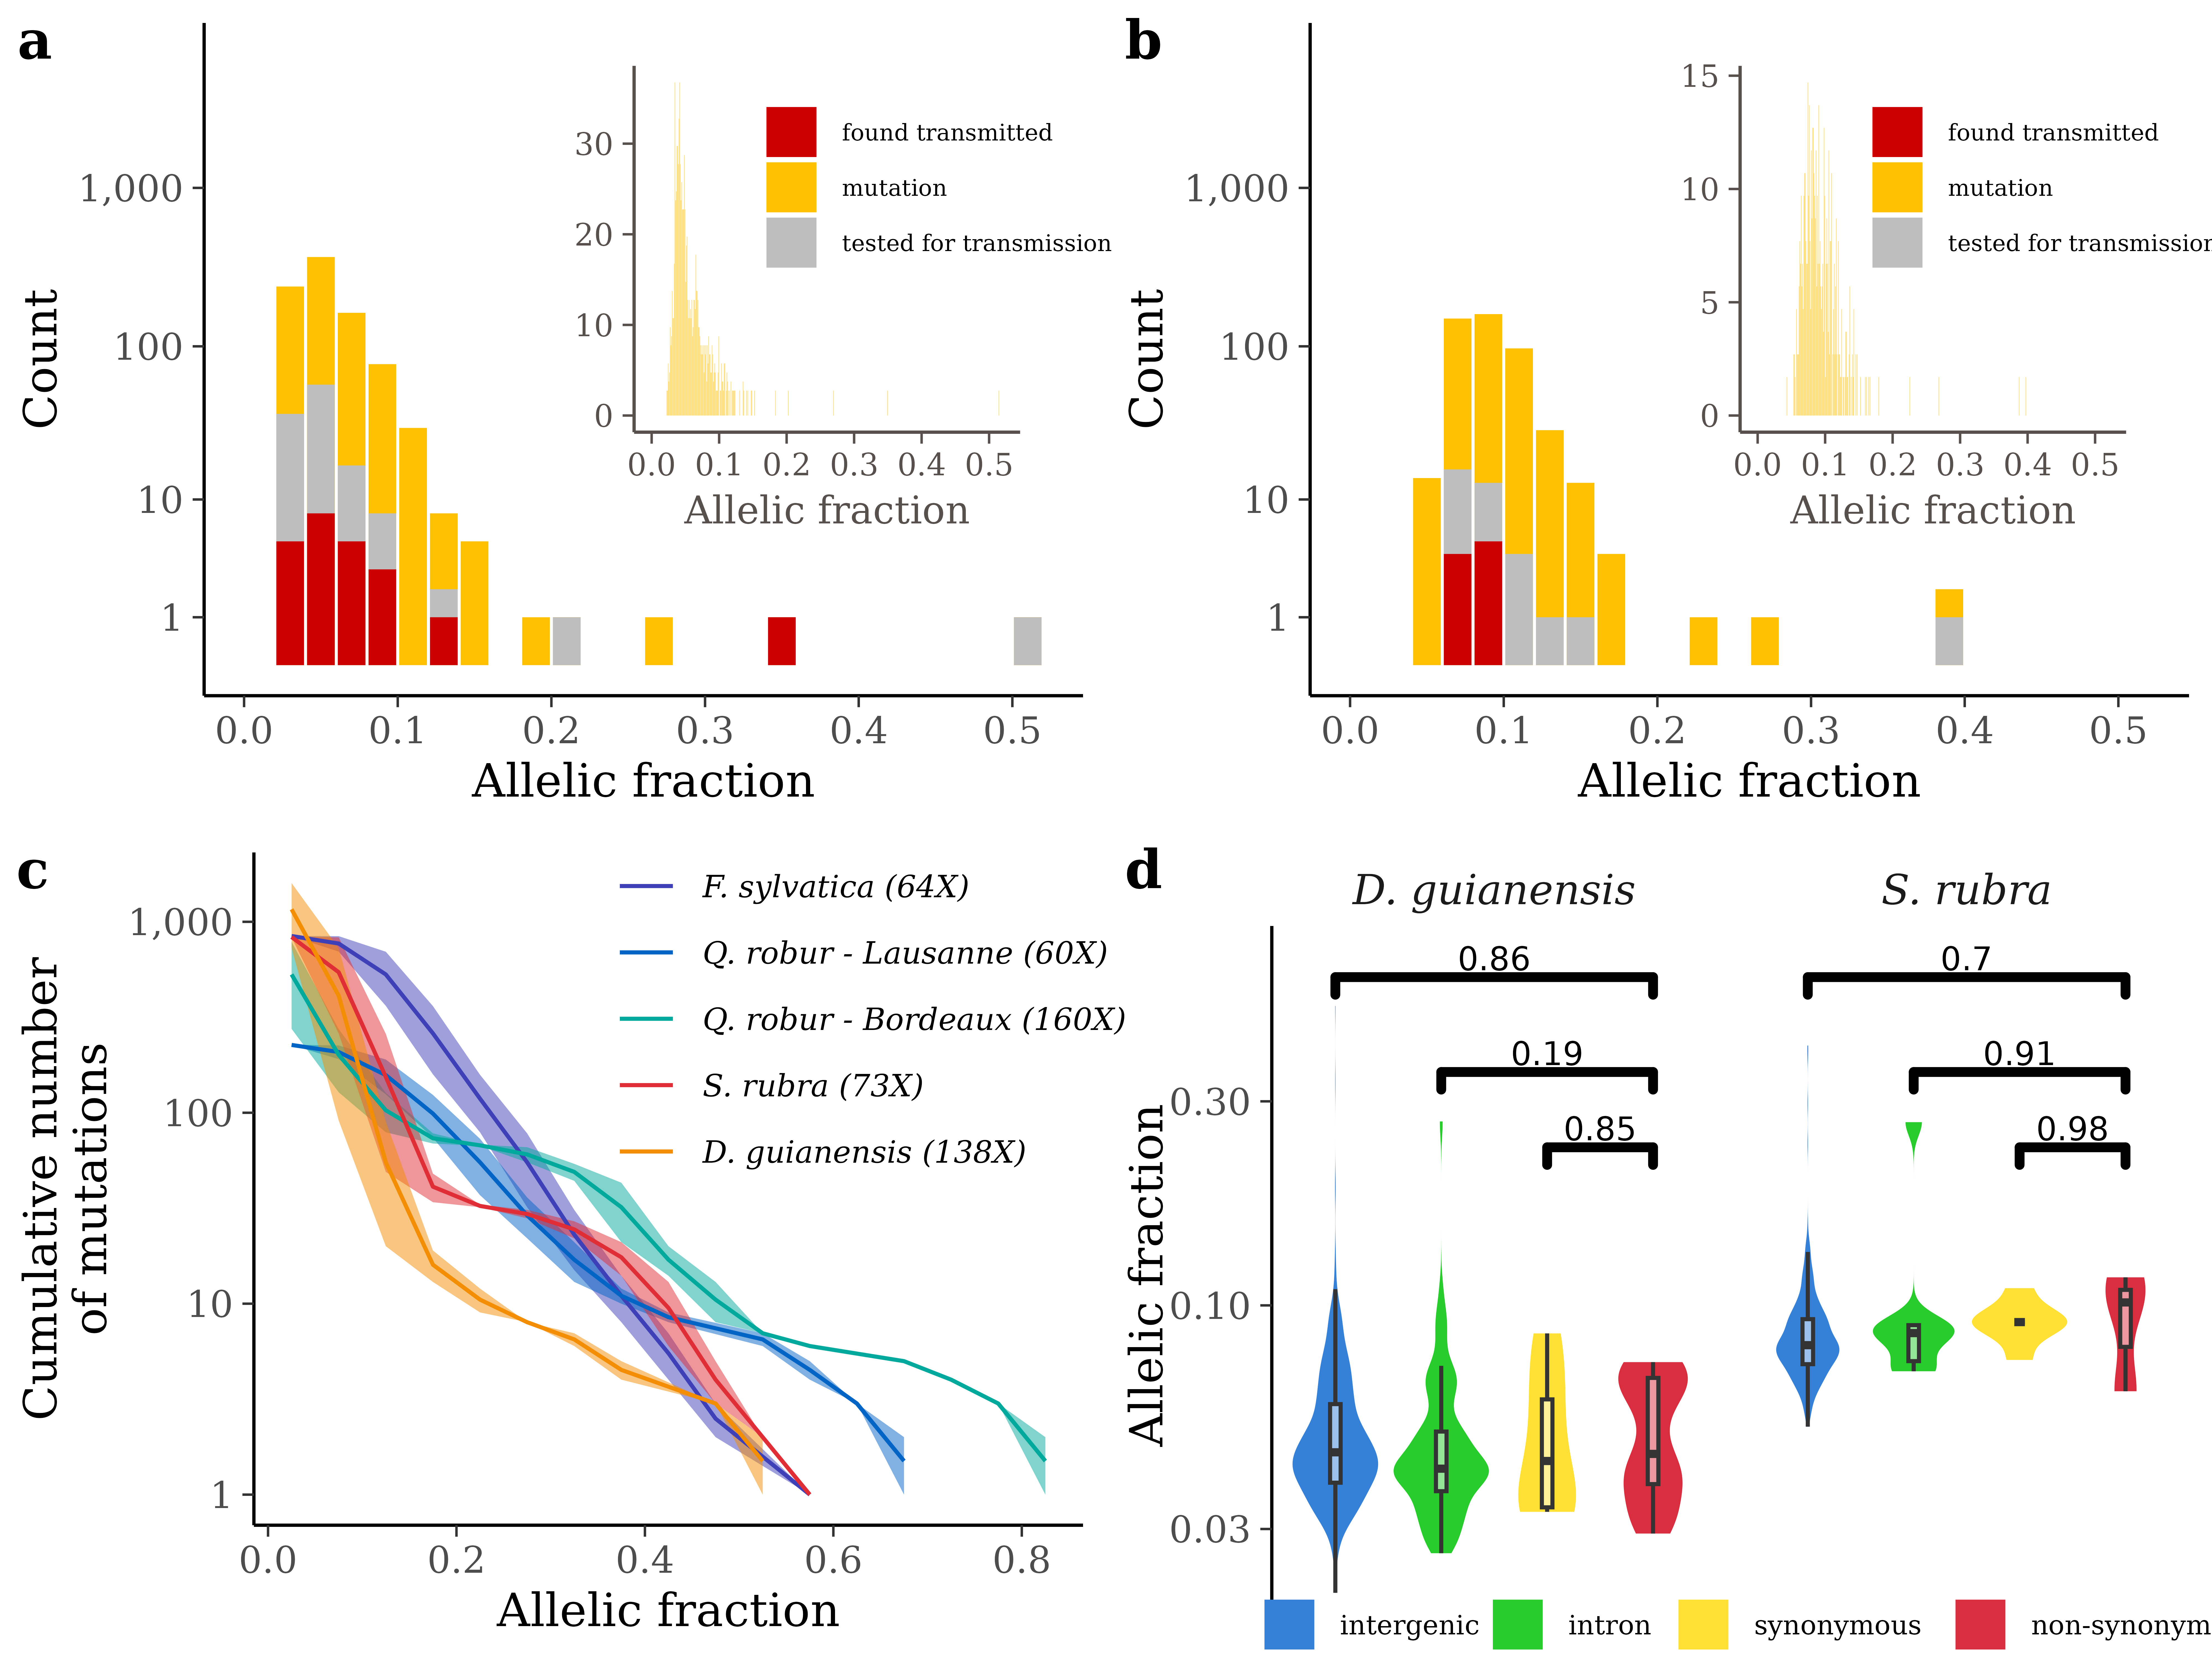
Figure 15.1: Fig. 3 | Allelic fractions of somatic mutations among trees and among genomic elements. Histogram of allelic fractions of mutations detected in the crown of the two tropical trees: the Dicorynia guianensis tree named Angela (a), and the Sextonia rubra tree named Sixto (b). The main histogram shows the allelic fractions of the somatic mutations using a bin of 0.02 and a log-transformed count with the mutations detected in the crown in yellow, the mutations tested for transmission in grey, and the mutations transmitted to the embryos in red. The inner histogram shows the allelic fractions of the somatic mutations using a bin of 0.001 and a natural count. (c) Cumulative number of somatic mutations per branch with decreasing allelic fraction for five trees reanalysed with the same pipeline. The five trees include the two tropical trees studied, the Dicorynia guianensis tree named Angela in orange and the Sextonia rubra tree named Sixto in red, and three temperate trees, two pedunculate oaks Quercus robur named 3P in green and Napoleon in blue and a tortuous beech Fagus sylvatica named Verzy in purple. All trees were analysed with the same pipeline (see methods) but were sequenced with a different depth indicated in brackets. The line represents the median value while the area represents the minimum and maximum values on the 2 to 10 branches per tree. (d) Comparisons of allelic fractions for non-synonymous mutations in red with synonymous mutations in yellow, intronic mutations in green and intergenic mutations in blue for the two tropical trees: the Dicorynia guianensis tree named Angela (left panel), and the Sextonia rubra tree named Sixto (right panel). The p-value above the bars indicates the significance of the Student’s T-test for the pairs of groups.