Chapter 10 Mutations Angela
This chapter describes the analyses of Angela mutations currently done in the the angela branch of the detectMutations repository.
10.1 Quality check
The results of multiQC are available for the haplotypes HS1 here and HS2 here. They globally all gave a green light for subsequent analyses.
10.2 Genome
We compared the two haplophases and chose HS1 for contiguity and length (Fig. 10.1 and Fig. 10.2) as well as mean coverage and homogeneity (Fig. 10.4).
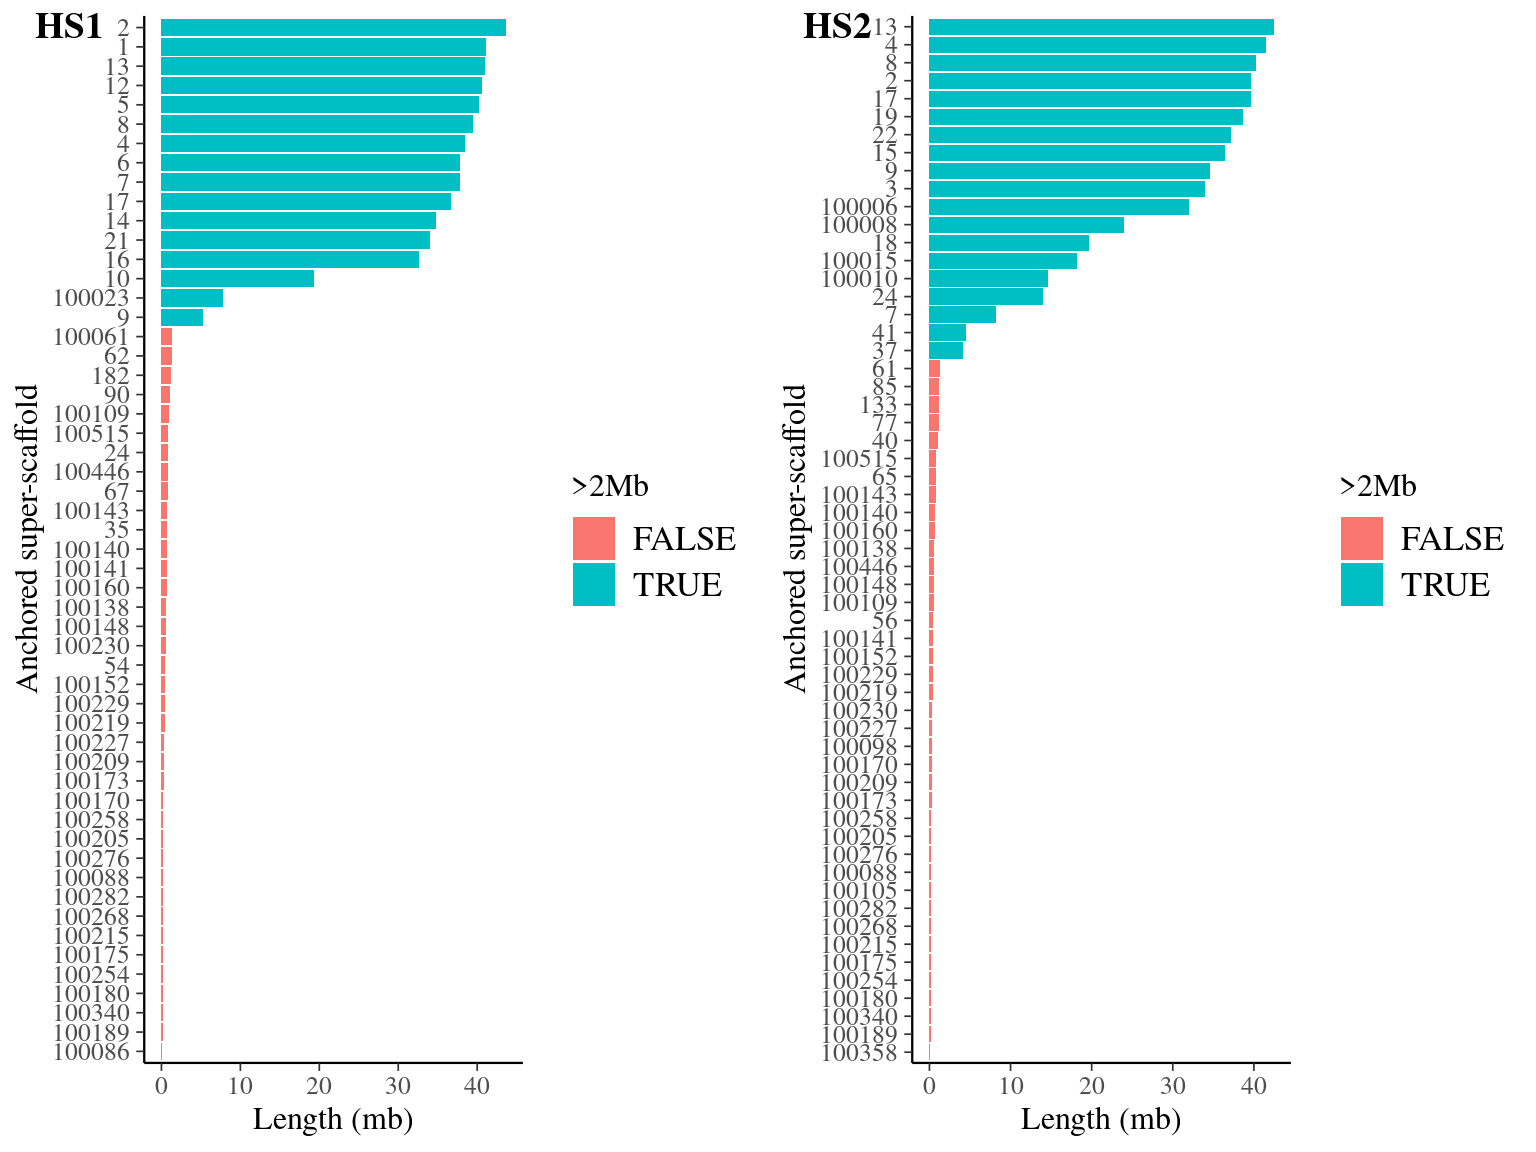
Figure 10.1: Anchored scaffolds size-distribution for haplotypes HS1 and HS2 in Angela’s genome.
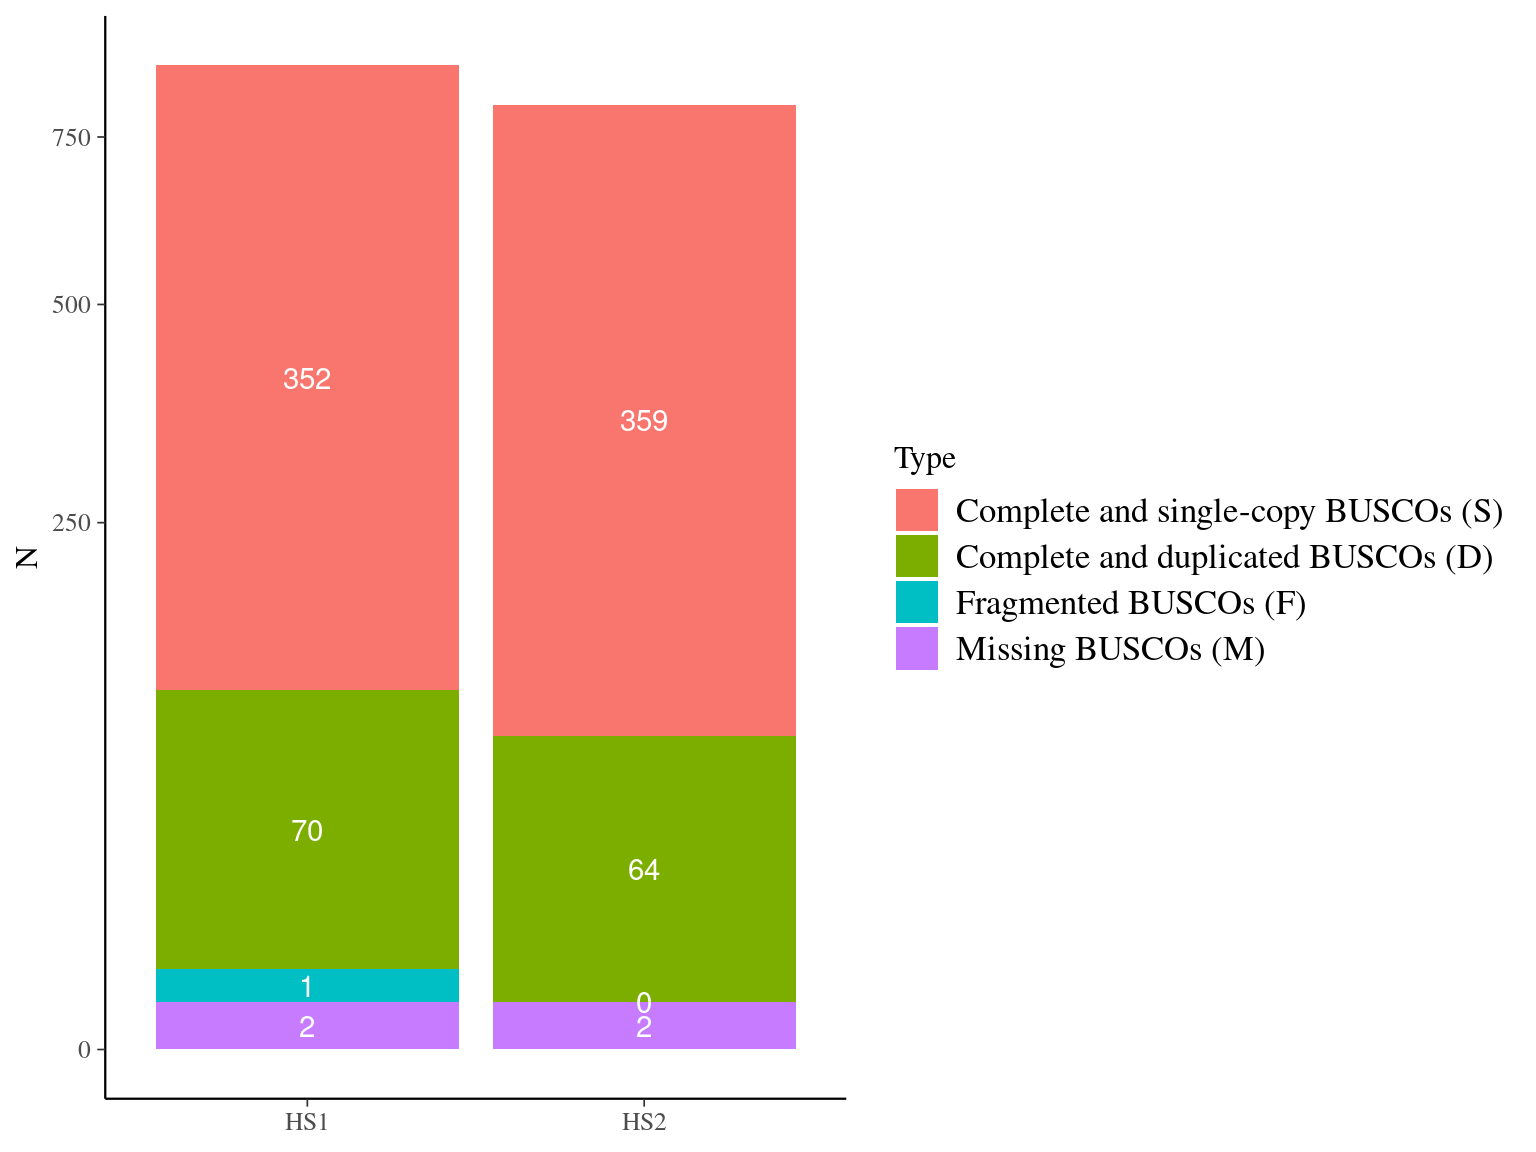
Figure 10.2: BUSCO results for haplotypes HS1 and HS2.
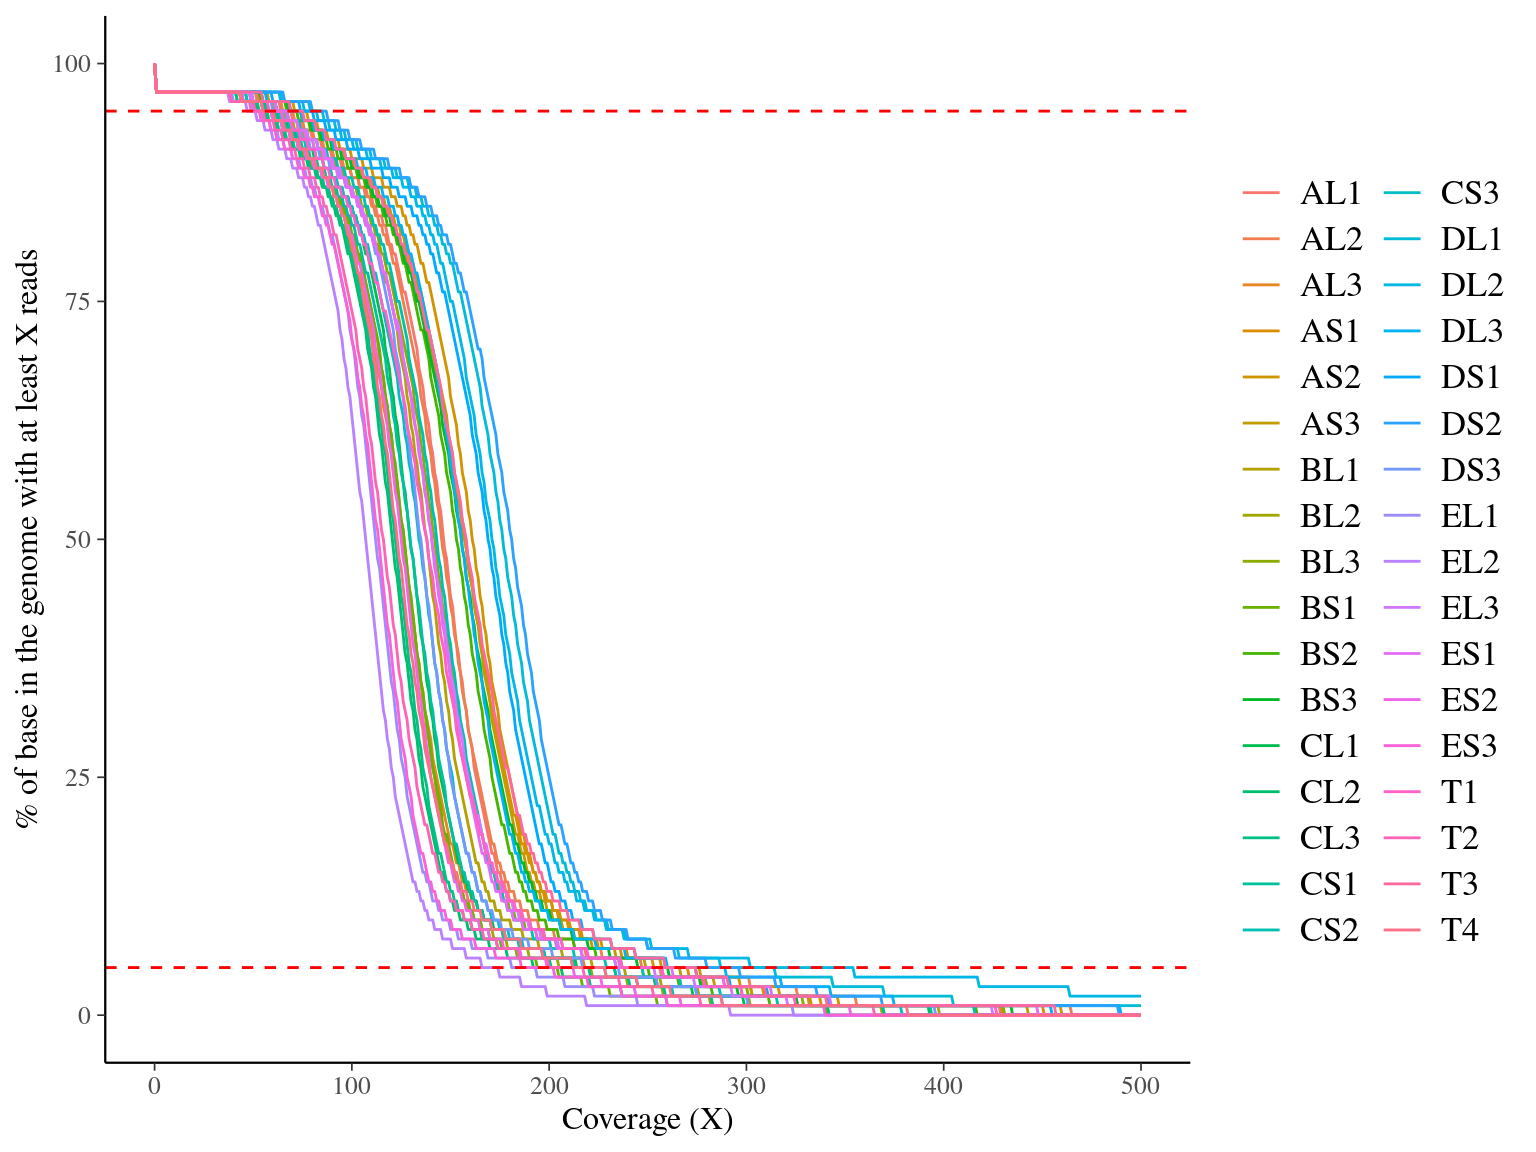
Figure 10.3: Coverage distribution. Distribution of the number of locations in the reference genome with a given depth of coverage.
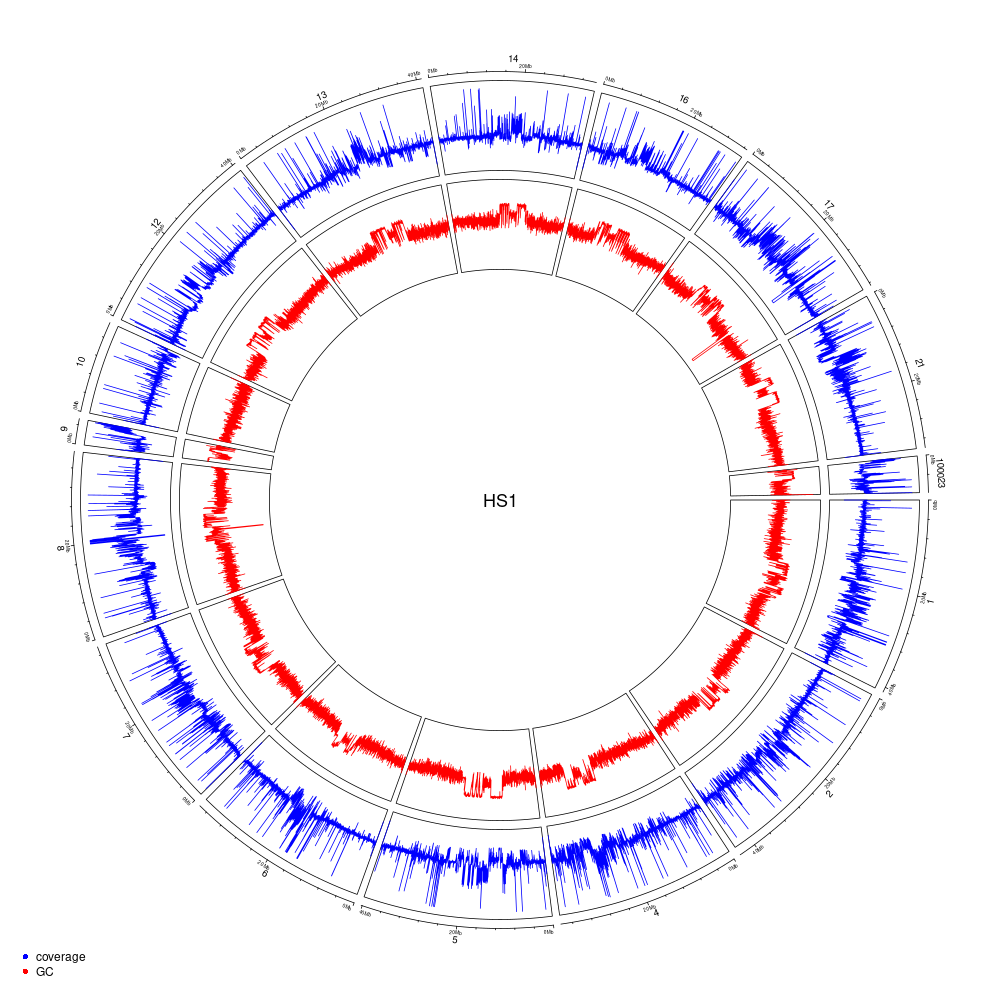
Figure 10.4: Genome coverage and GC-content on a 10-kb windows for the HS1 haplotype (scaffolds > 2-Mb).
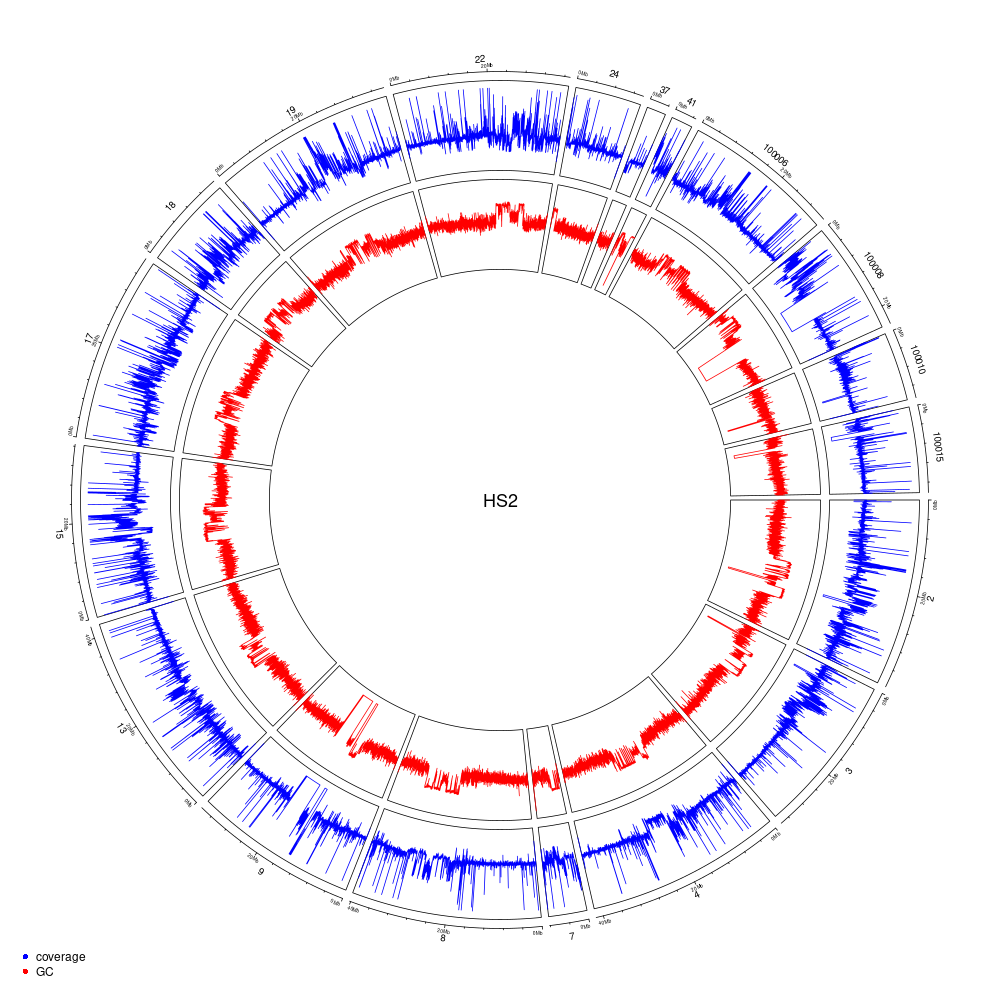
Figure 10.5: Genome coverage and GC-content on a 10-kb windows for the HS2 haplotype (scaffolds > 2-Mb).

10.2.3 Comp
##
## Call:
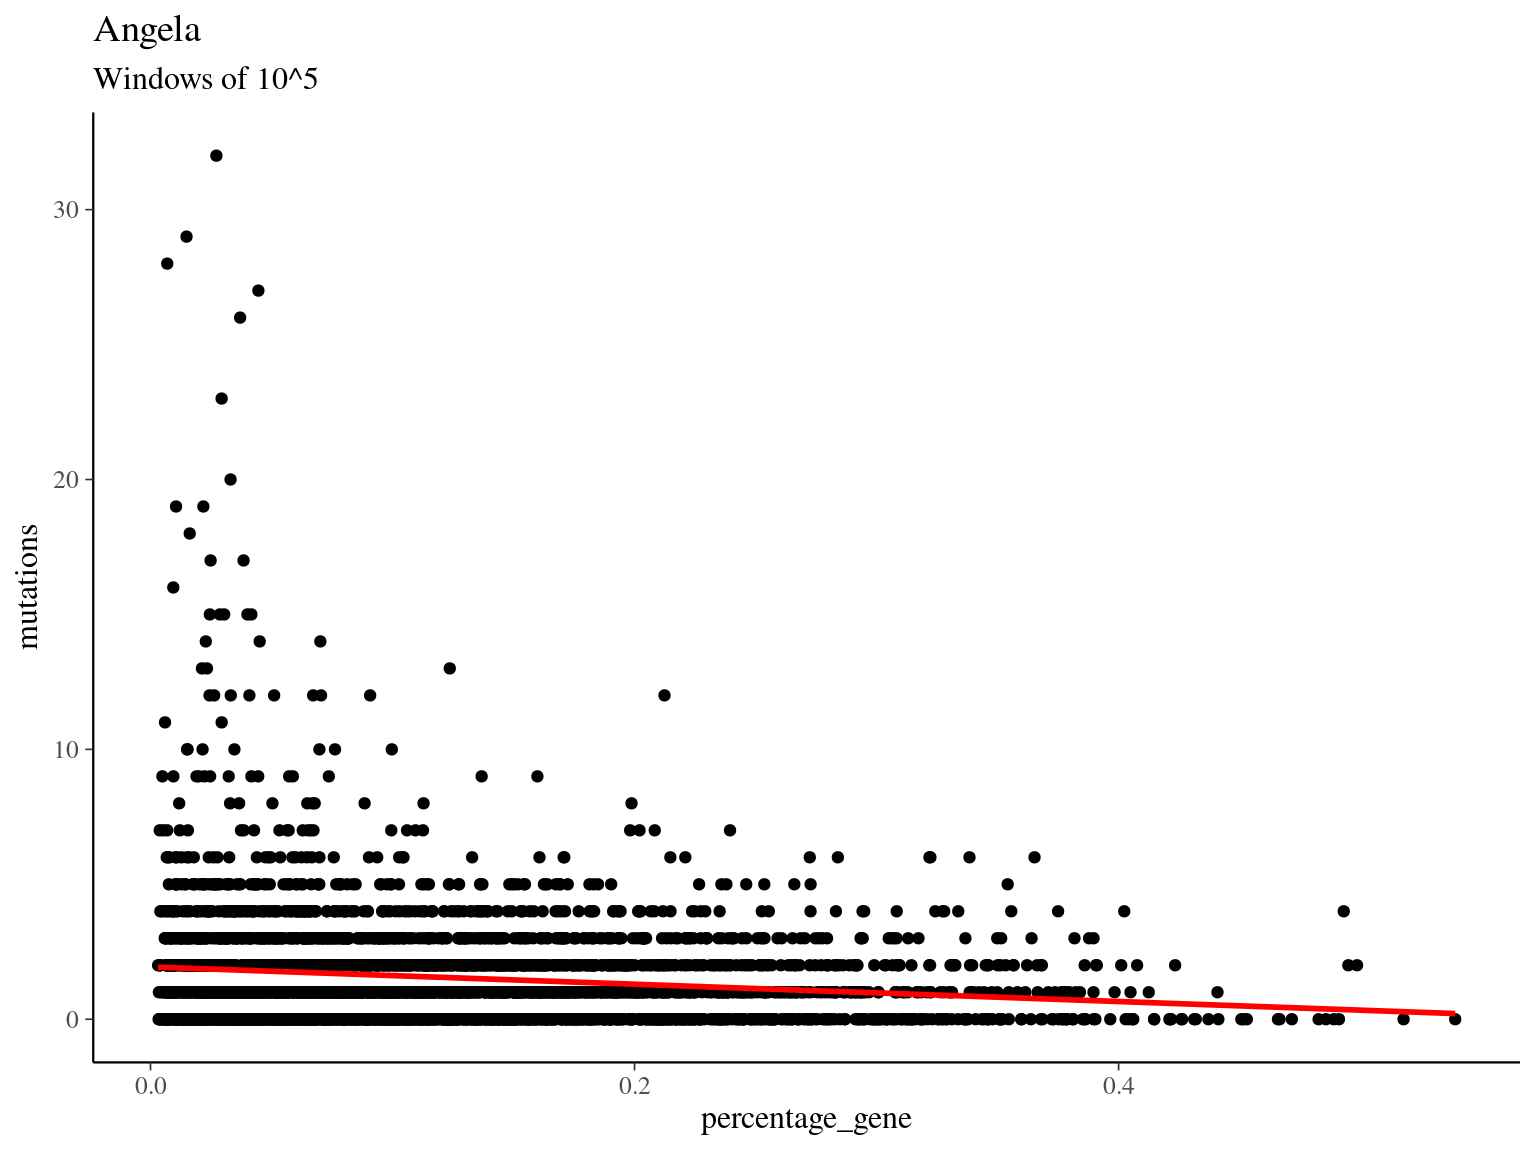
## glm(formula = mutations ~ percentage_gene, family = "poisson",
## data = all)
##
## Coefficients:
## Estimate Std. Error z value Pr(>|z|)
## (Intercept) 0.69760 0.02017 34.58 <2e-16 ***
## percentage_gene -2.31318 0.15468 -14.96 <2e-16 ***
## ---
## Signif. codes: 0 '***' 0.001 '**' 0.01 '*' 0.05 '.' 0.1 ' ' 1
##
## (Dispersion parameter for poisson family taken to be 1)
##
## Null deviance: 8716.4 on 4134 degrees of freedom
## Residual deviance: 8474.1 on 4133 degrees of freedom
## AIC: 15578
##
## Number of Fisher Scoring iterations: 5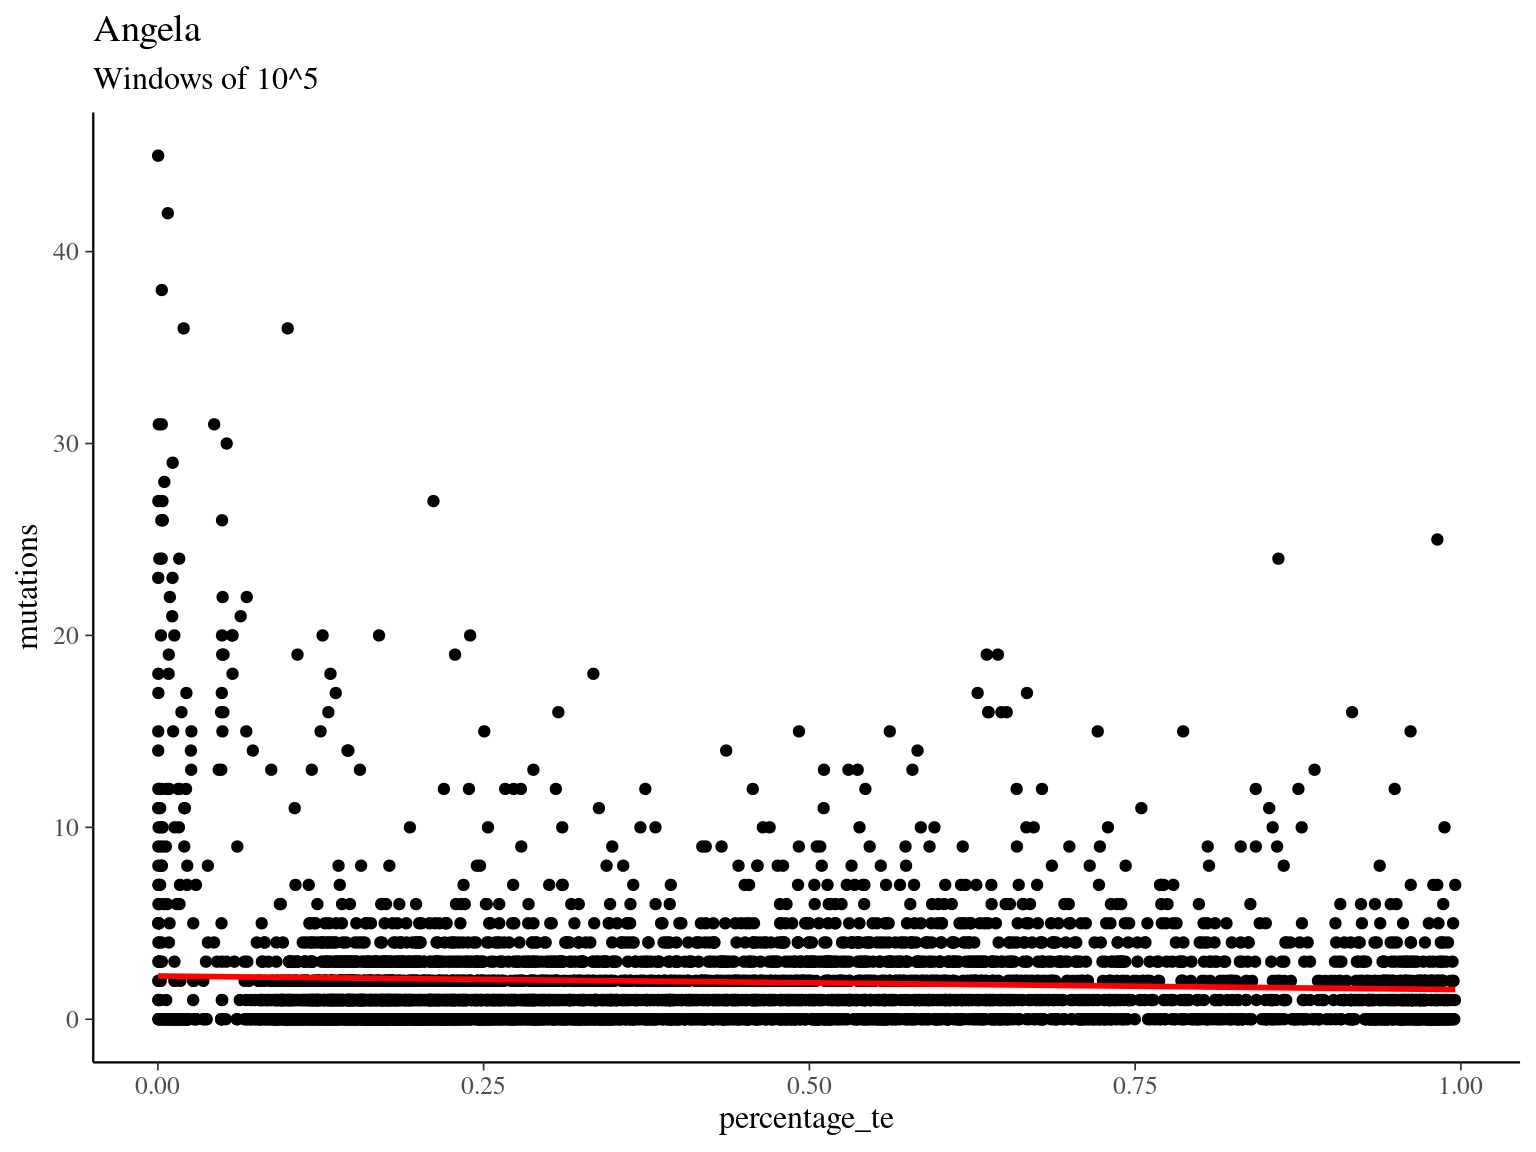
##
## Call:
## glm(formula = mutations ~ percentage_te, family = "poisson",
##     data = all)
##
## Coefficients:
##               Estimate Std. Error z value Pr(>|z|)
## (Intercept)    0.82114    0.01764   46.54   <2e-16 ***
## percentage_te -0.37257    0.03857   -9.66   <2e-16 ***
## ---
## Signif. codes:  0 '***' 0.001 '**' 0.01 '*' 0.05 '.' 0.1 ' ' 1
##
## (Dispersion parameter for poisson family taken to be 1)
##
##     Null deviance: 15698  on 4920  degrees of freedom
## Residual deviance: 15602  on 4919  degrees of freedom
## AIC: 24551
##
## Number of Fisher Scoring iterations: 6
10.3 Heterozygosity
We used k-mer analyses (21-mers) using jellyfish and the GenomeScope to estimate genetic diversity \(\pi=0.901%\) (Fig. 10.6).
Should I also estimate non-synonymous diversity with ORF annotation using transdecoder and SNPdat (https://phdpages.netlify.app/6b189d4142e8224bff99e28abd11cbfdd50c51b1/symcapture/annotation.html#synonymy)?
We detected and filtered SNPs as follow:
- Raw=5M : raw result from
GATK HaplotypeCaller + GenomicsDBImport + GenotypeGVCFs - Biallelic=5.3M : biallelic sites with
bcftools - SNP=4.7M : SNPs with
GATK - Filtered=3.85M : SNPs with QUAL < 30, QD < 2, FS > 60, SOR > 3 using
GATK - Non-missing=3.84M : SNPs in all genotypes and individuals with
plink - Shared=3.84M : shared SNPs by at least 32 out of 33 individuals with
bcftools

Figure 10.6: GenomeScope Profile. Full results here: http://genomescope.org/analysis.php?code=ayEfgONEP1cFWw2yjhfb.
10.4 Mutations filters
We removed all candidate mutations present in the heterozygous sites and in the raw candidate mutations from the cambium.
We kept only mutations with no copy of the mutated allele in the normal sample (NAC, normal_altCount == 0).
We tested independently the effect of 4 filters and look their effect on (1) the percentage kept, (2) the distribution of allelic frequencies, and (3) the overlap between filters:
- MAC: a minimum of 5 copies of the mutated allele in the mutated sample (
mutation_altCount >= 5) - DP: a read depth for the two sample between the 5th quantile and the 95th quantile of the coverage of the corresponding library (
normal_DP <= high_cov, normal_DP >= low_cov, mutation_DP <= high_cov, mutation_DP >= low_cov) - BIO: the mutation is present in at least two biological replicates (2 leaves from the crown)
- EVS:
Strelka 2automatic filtering based on the empiric variant score (Filter == "PASS")
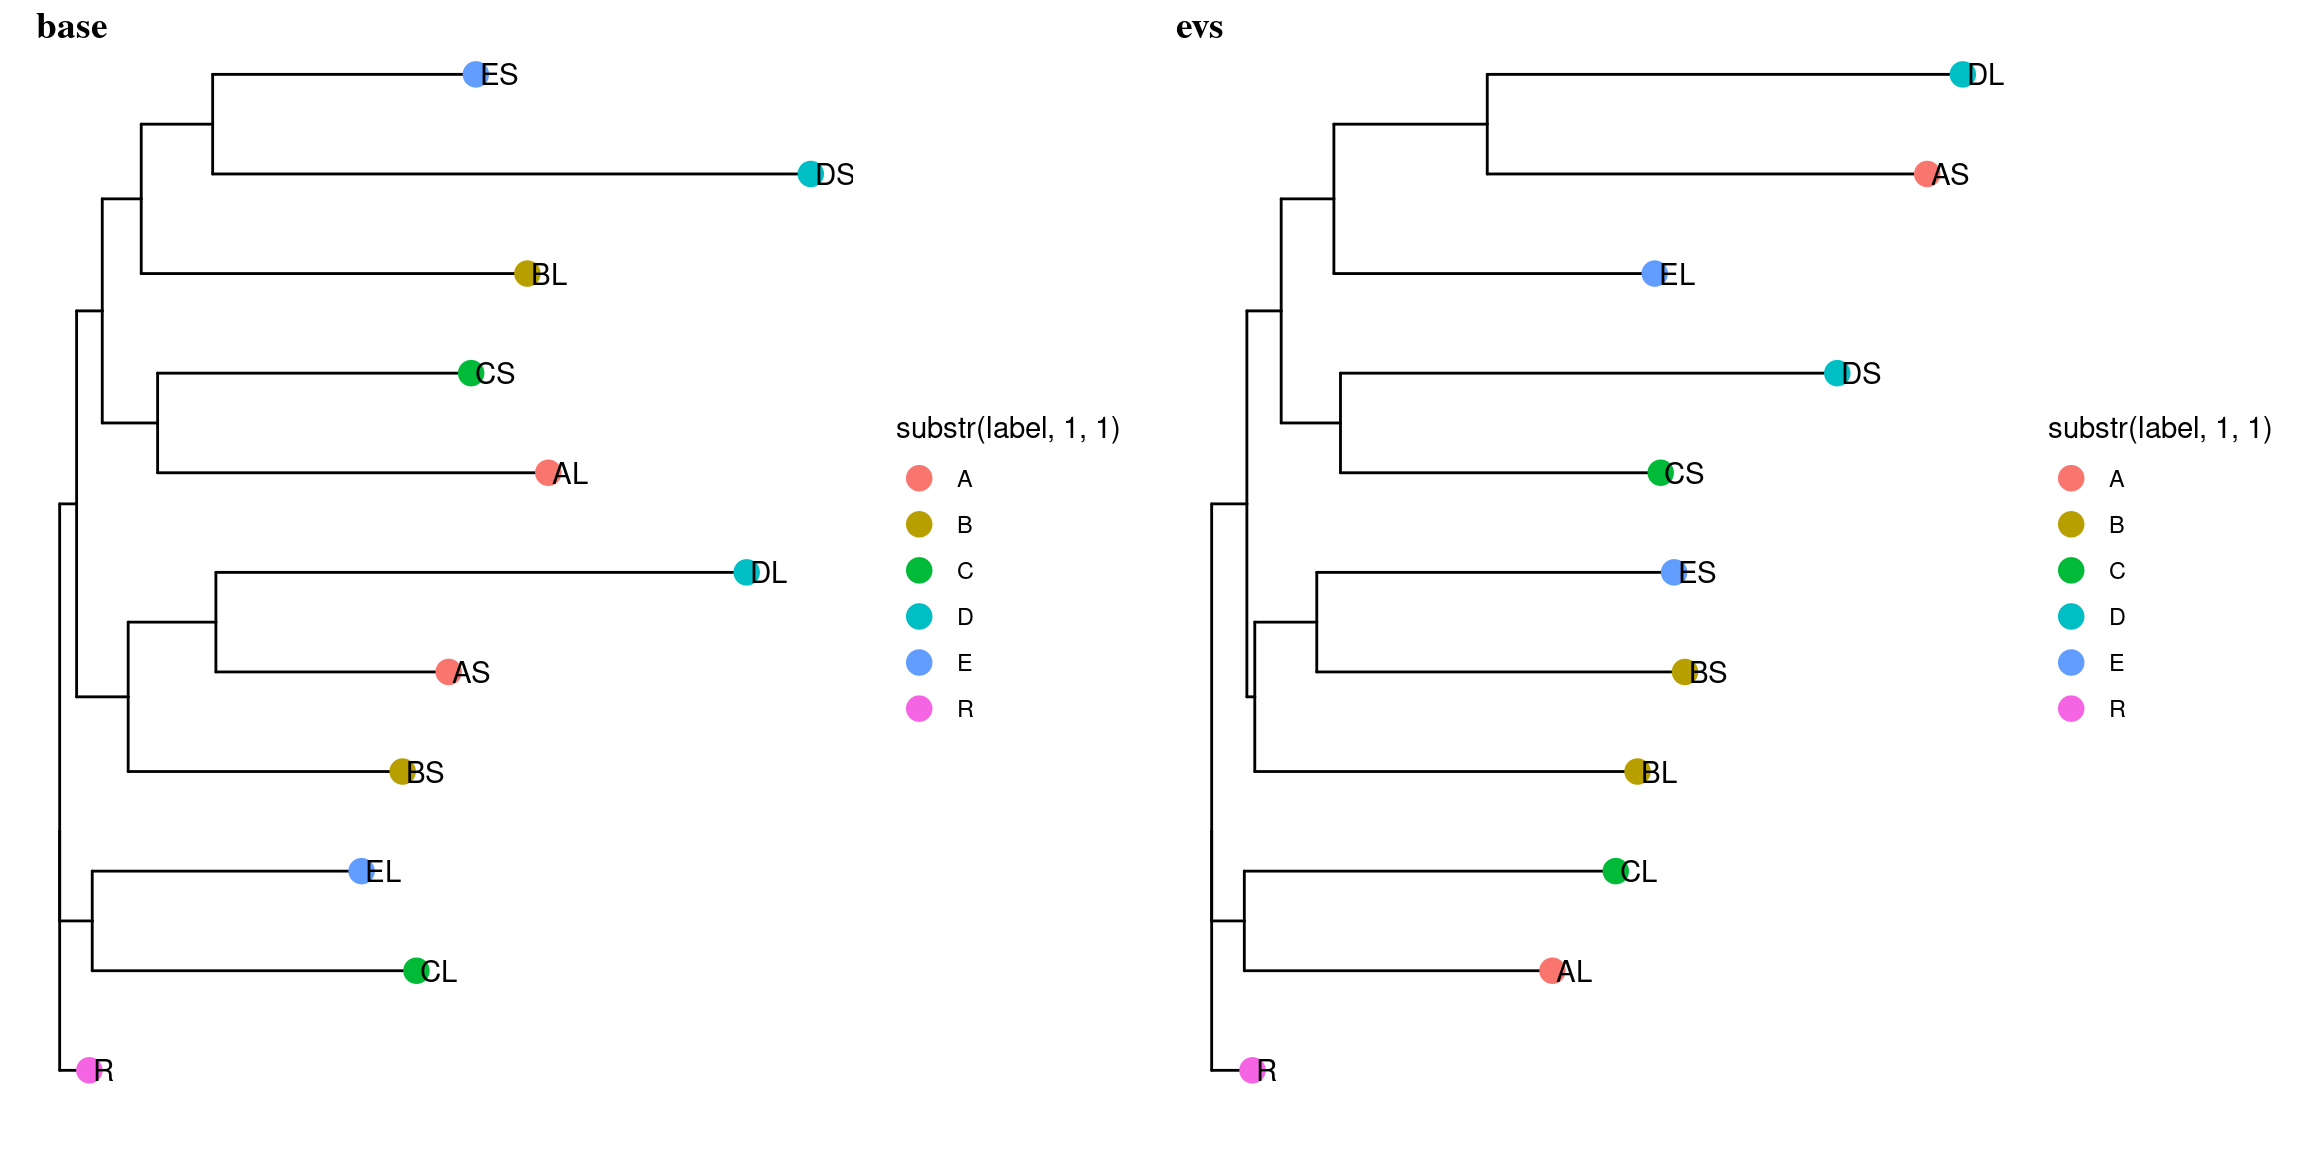
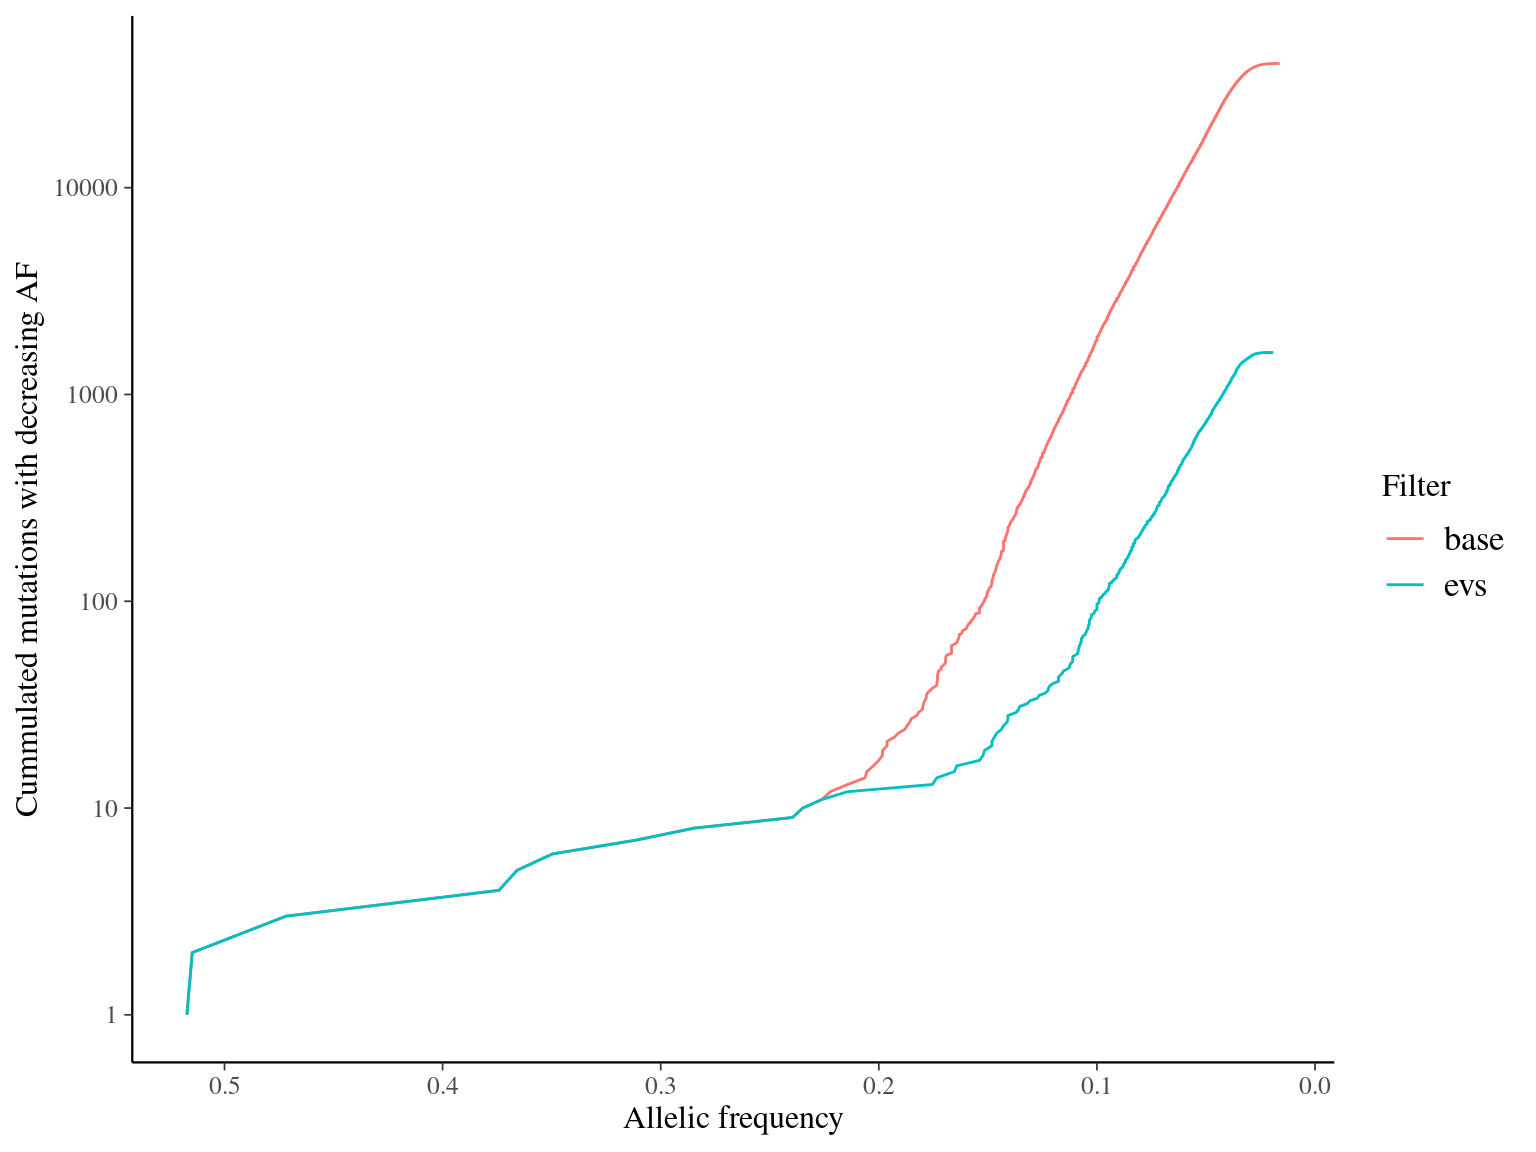
MAC and EVS are the most stringent filters (Fig. 10.7, and mostly MAC filter changes the allele frequencies distribution (Fig. 10.8. Most filters share mutations, except EVS and BIO that rejected individually a lot mutations shared by the two others (Fig. 10.9. And all filters except MAC are not sensitive to the library coverage (Fig. 10.10. We will thus use two filters for next steps:
- base:
- NAC: no copy of the mutated allele in the normal sample (
normal_altCountT1 == 0) - MAC: a minimum of 5 copies of the mutated allele in the mutated sample (
mutation_altCount >= 5) - DP: a read depth for the two sample between the 10th quantile and the 90th quantile of the coverage of the mutated library (
normal_DP <= high_cov, normal_DP >= low_cov, mutation_DP <= high_cov, mutation_DP >= low_cov) - BIO: the mutation is present in at least two biological replicates (2 leaves from the crown)
- NAC: no copy of the mutated allele in the normal sample (
- evs:
- base
- EVS:
Strelka 2automatic filtering based on the empiric variant score (Filter == "PASS")
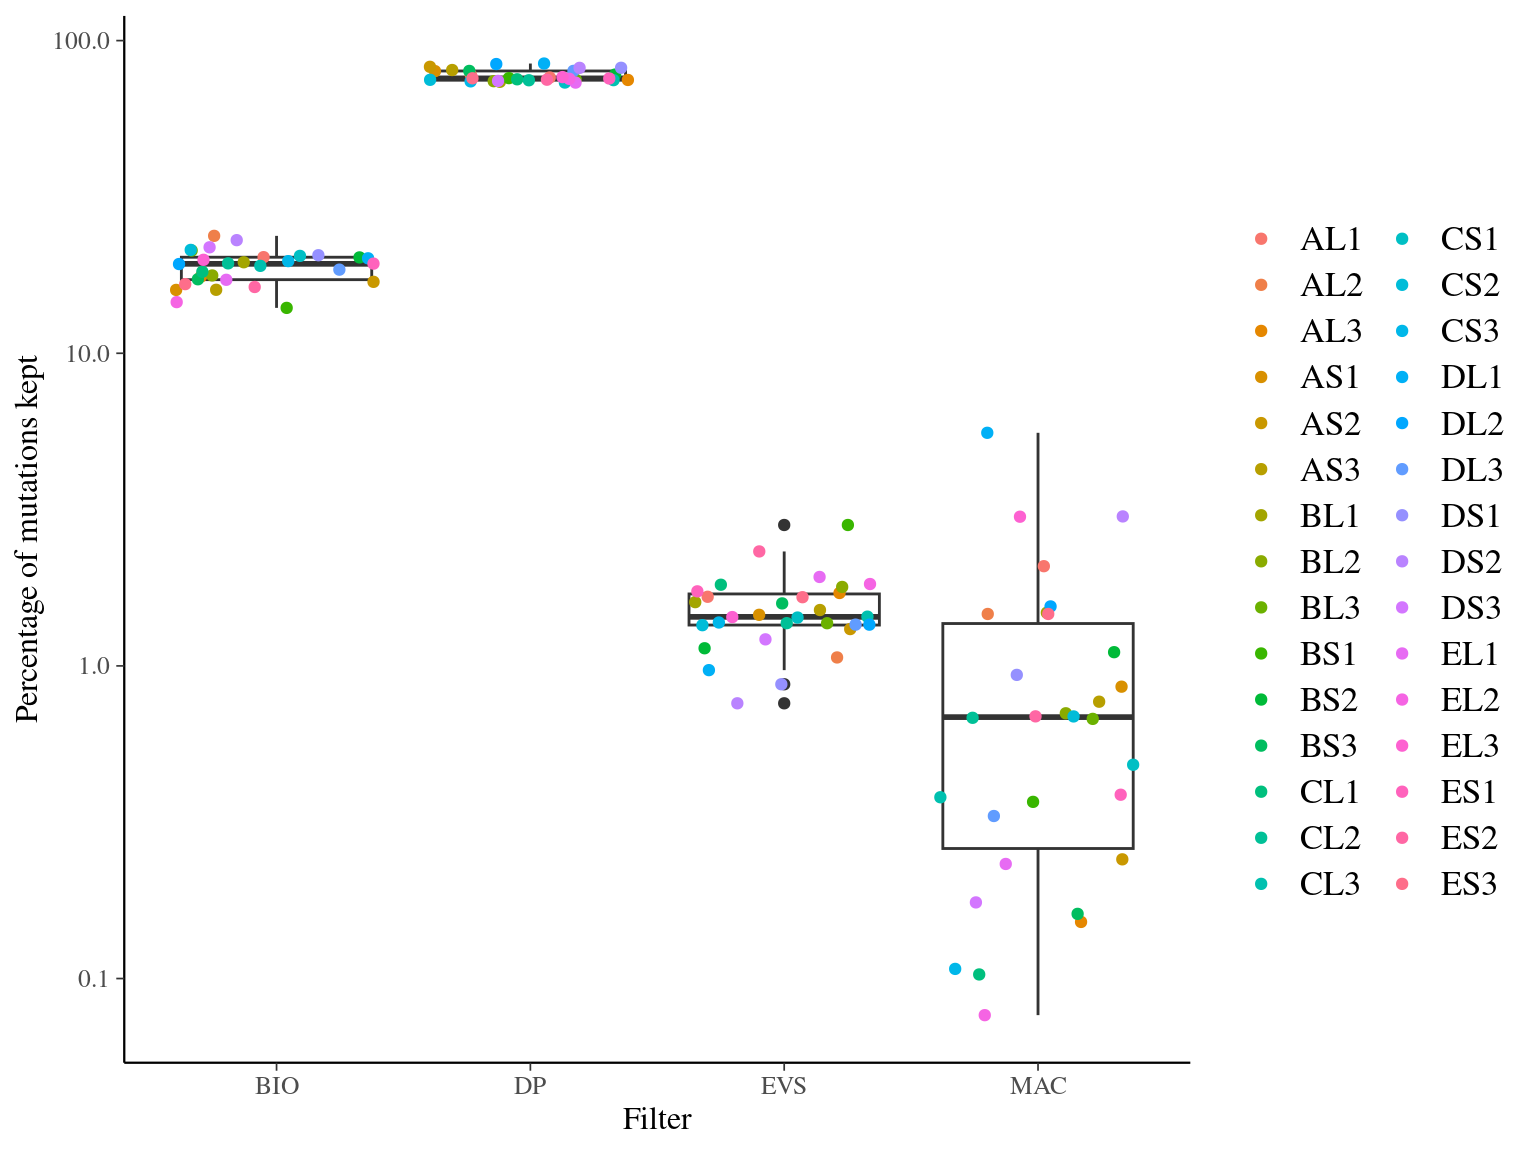
Figure 10.7: Percentage of kept mutations per filter.

Figure 10.8: Alleles frequencies of filtered mutations.

Figure 10.9: Filtered mutations sharing across filters.
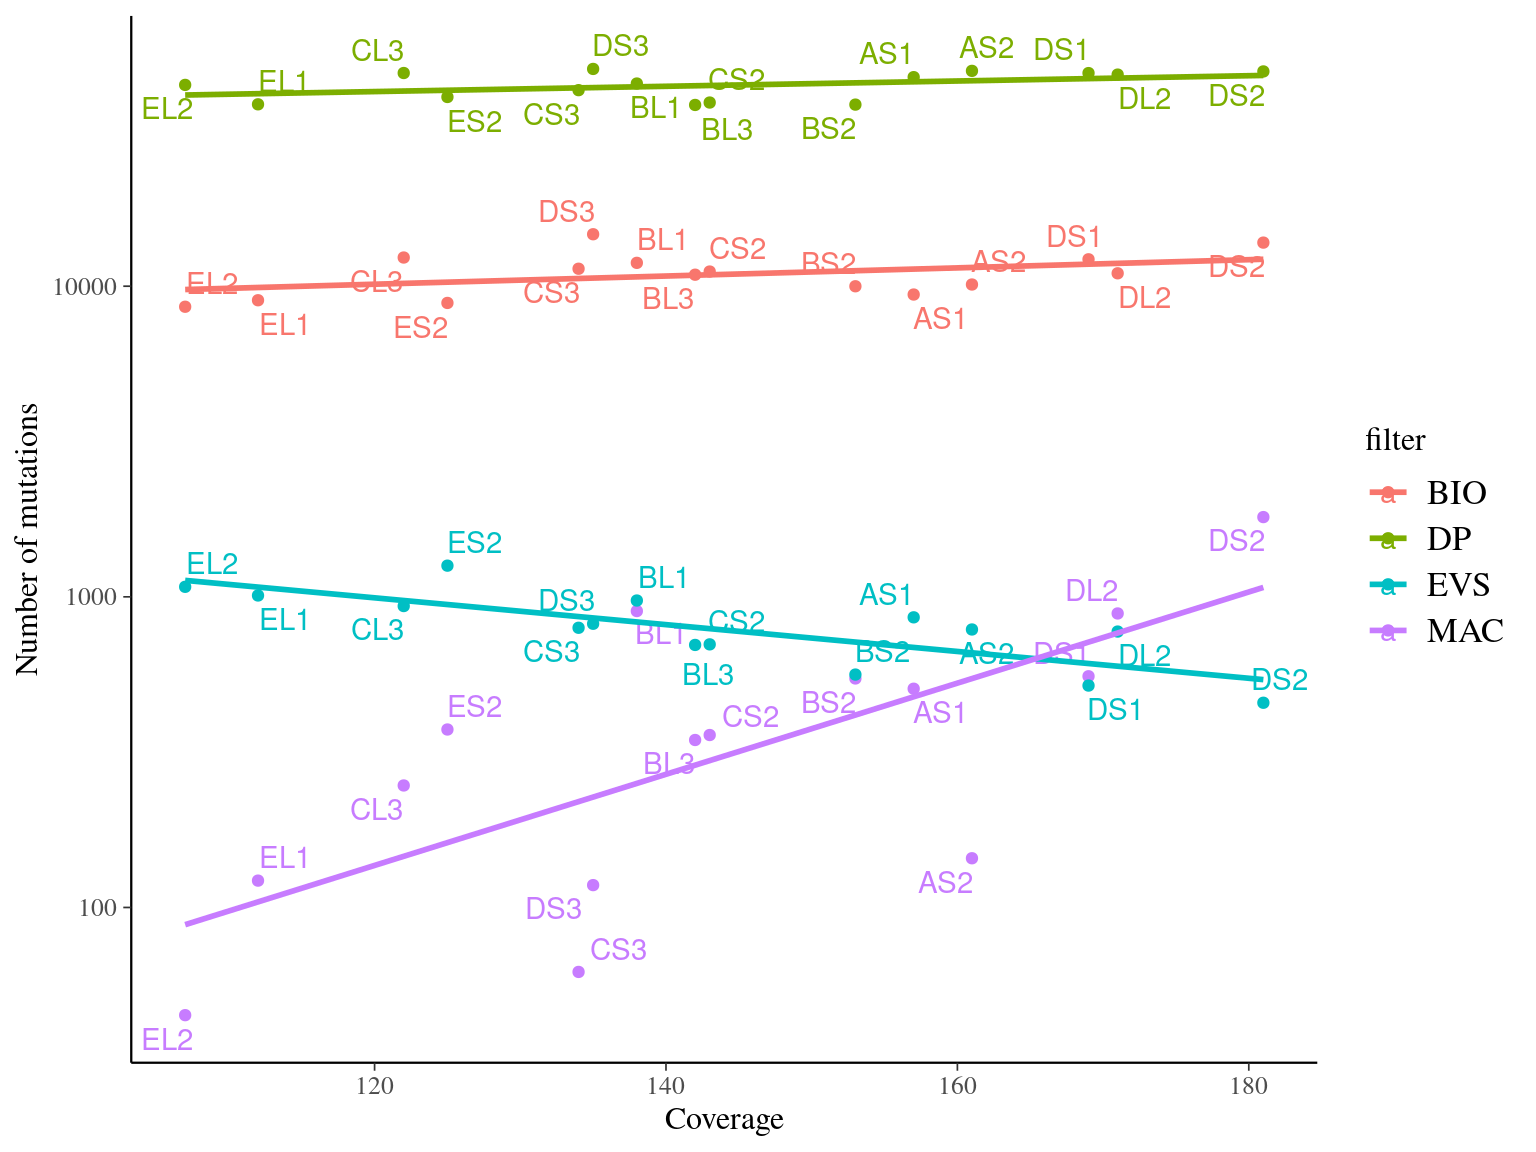
Figure 10.10: Link between the number of detected mutations and the coverage across samples depending on the filter used.
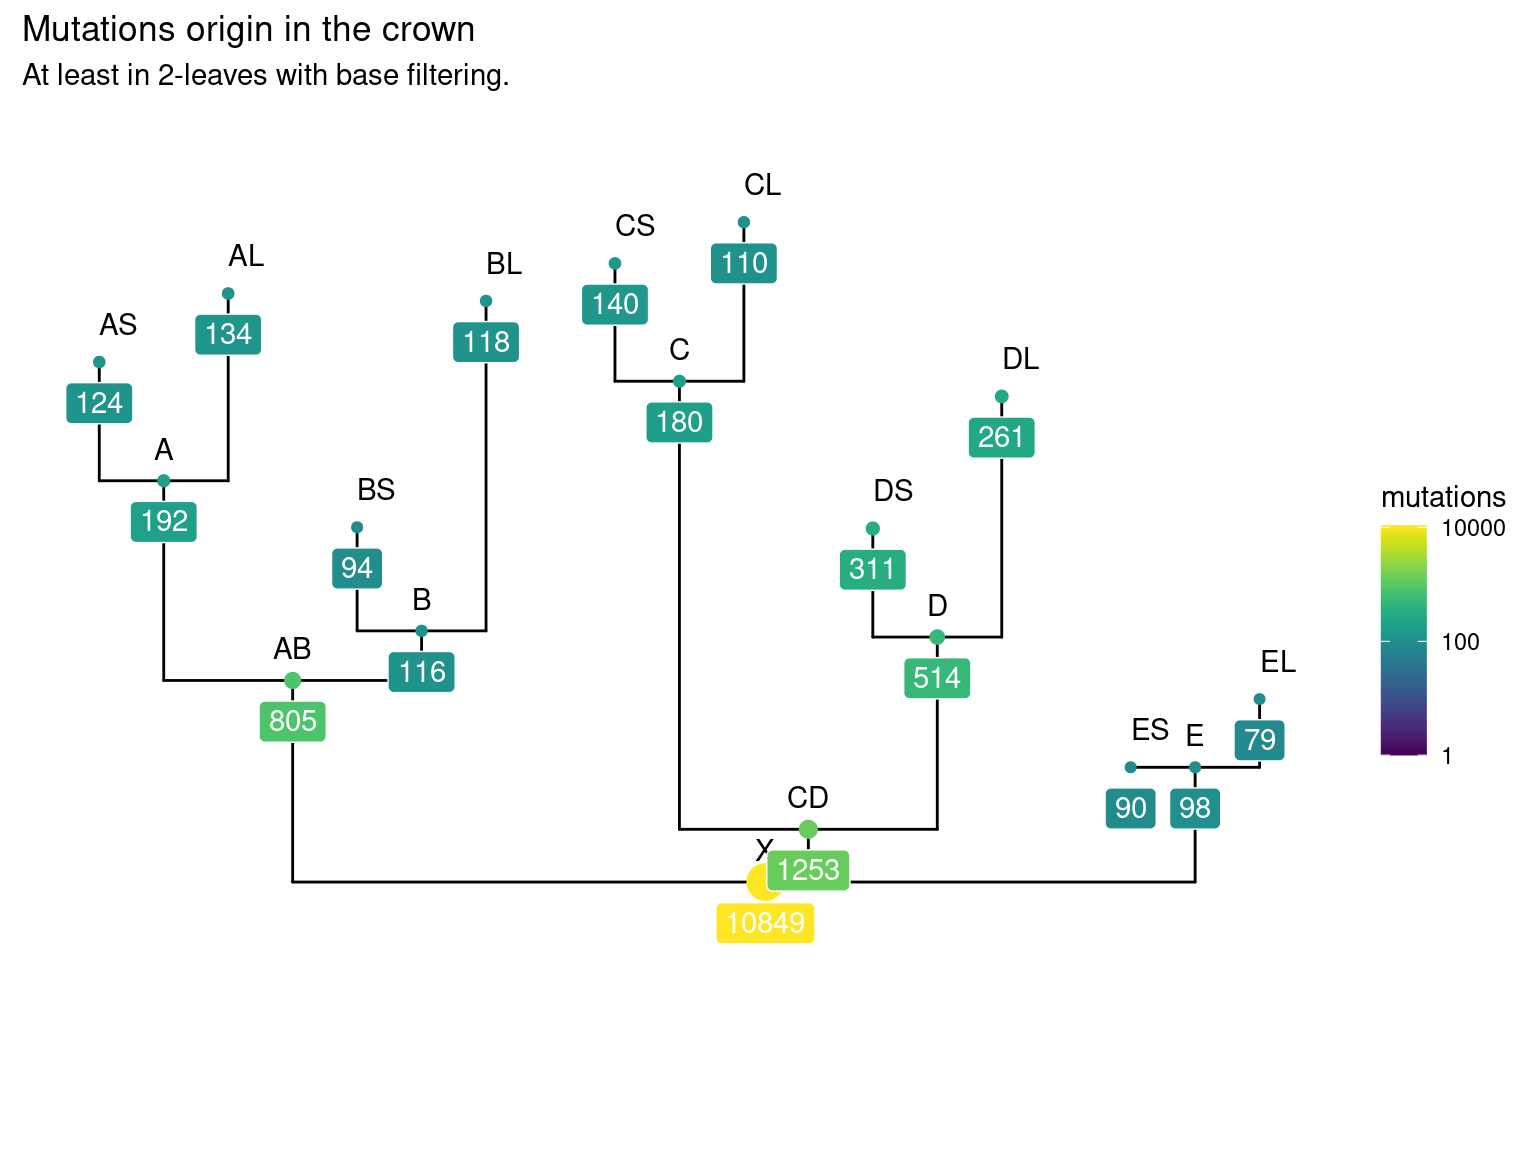
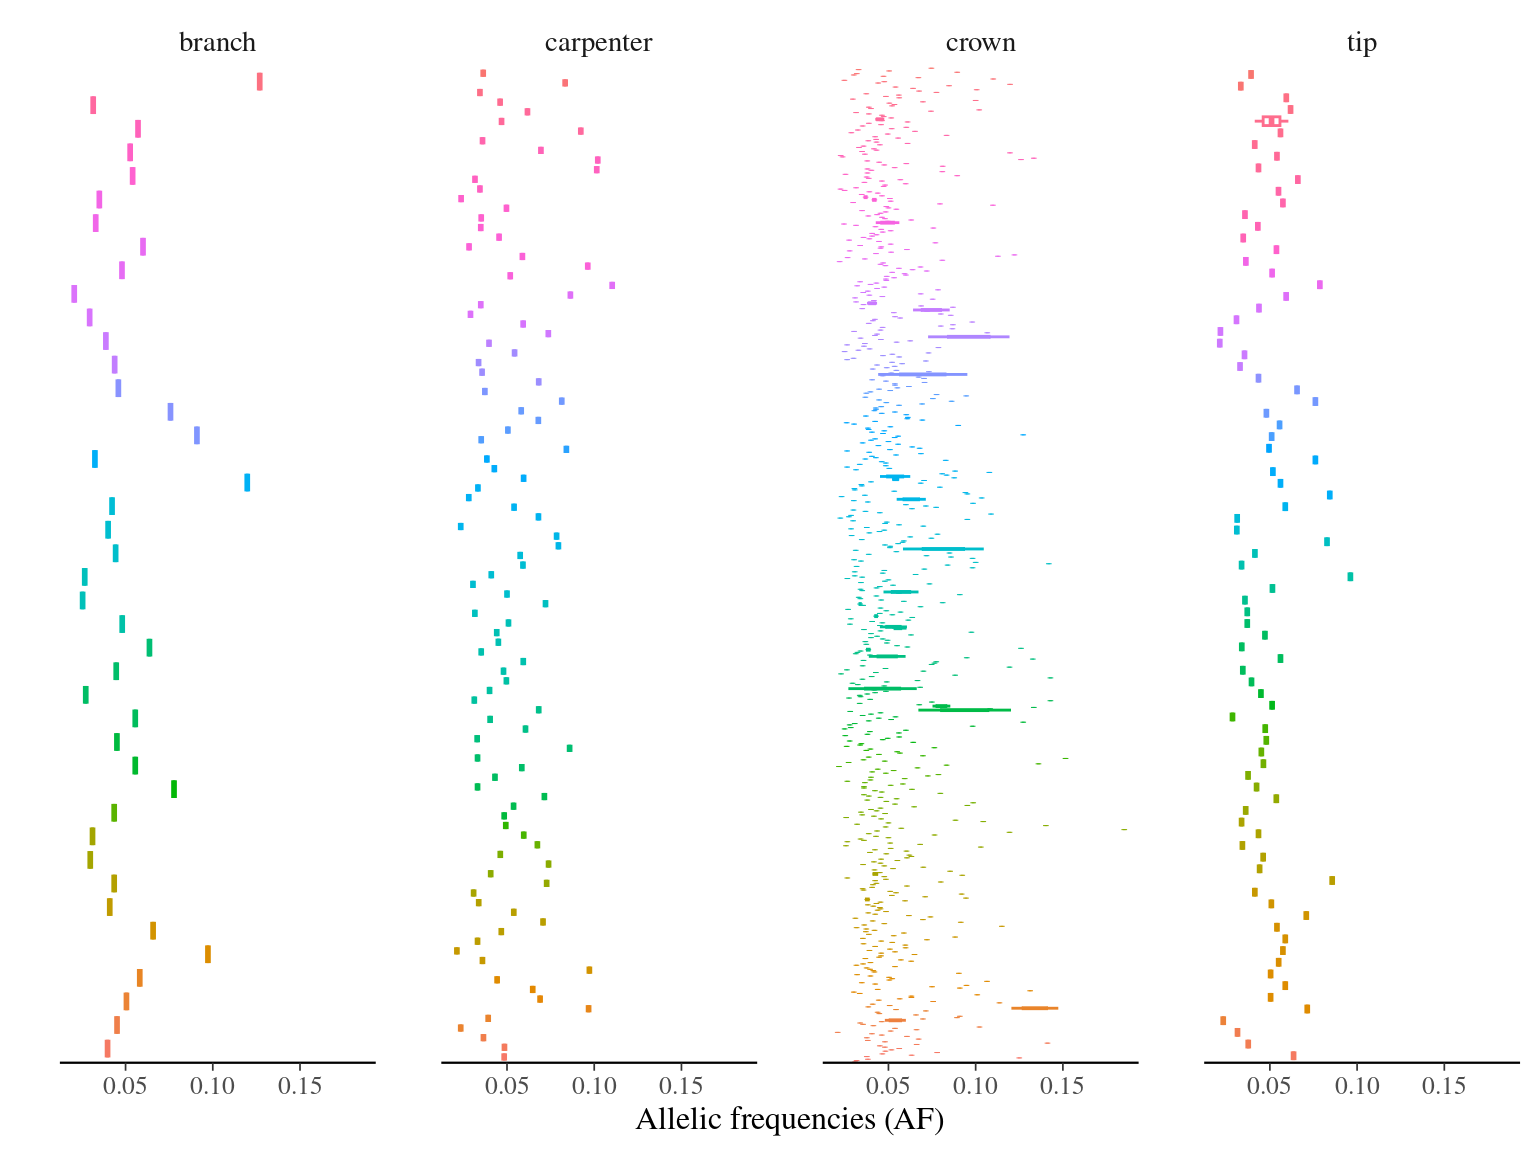
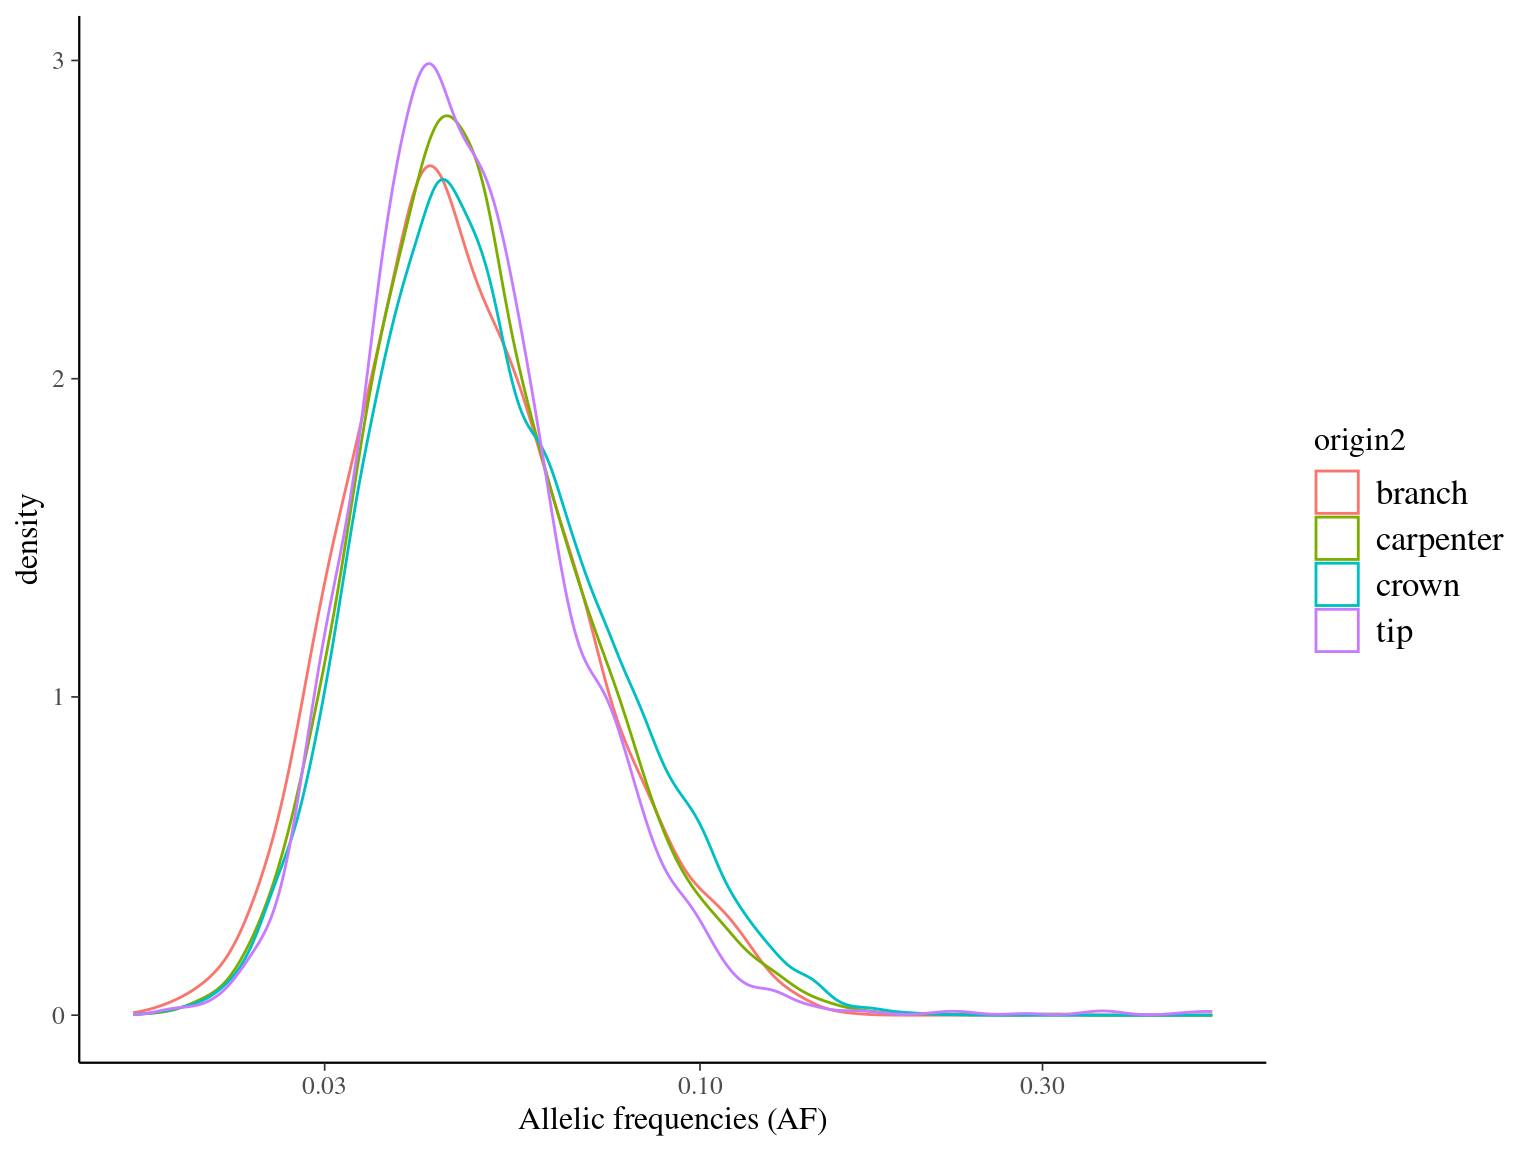
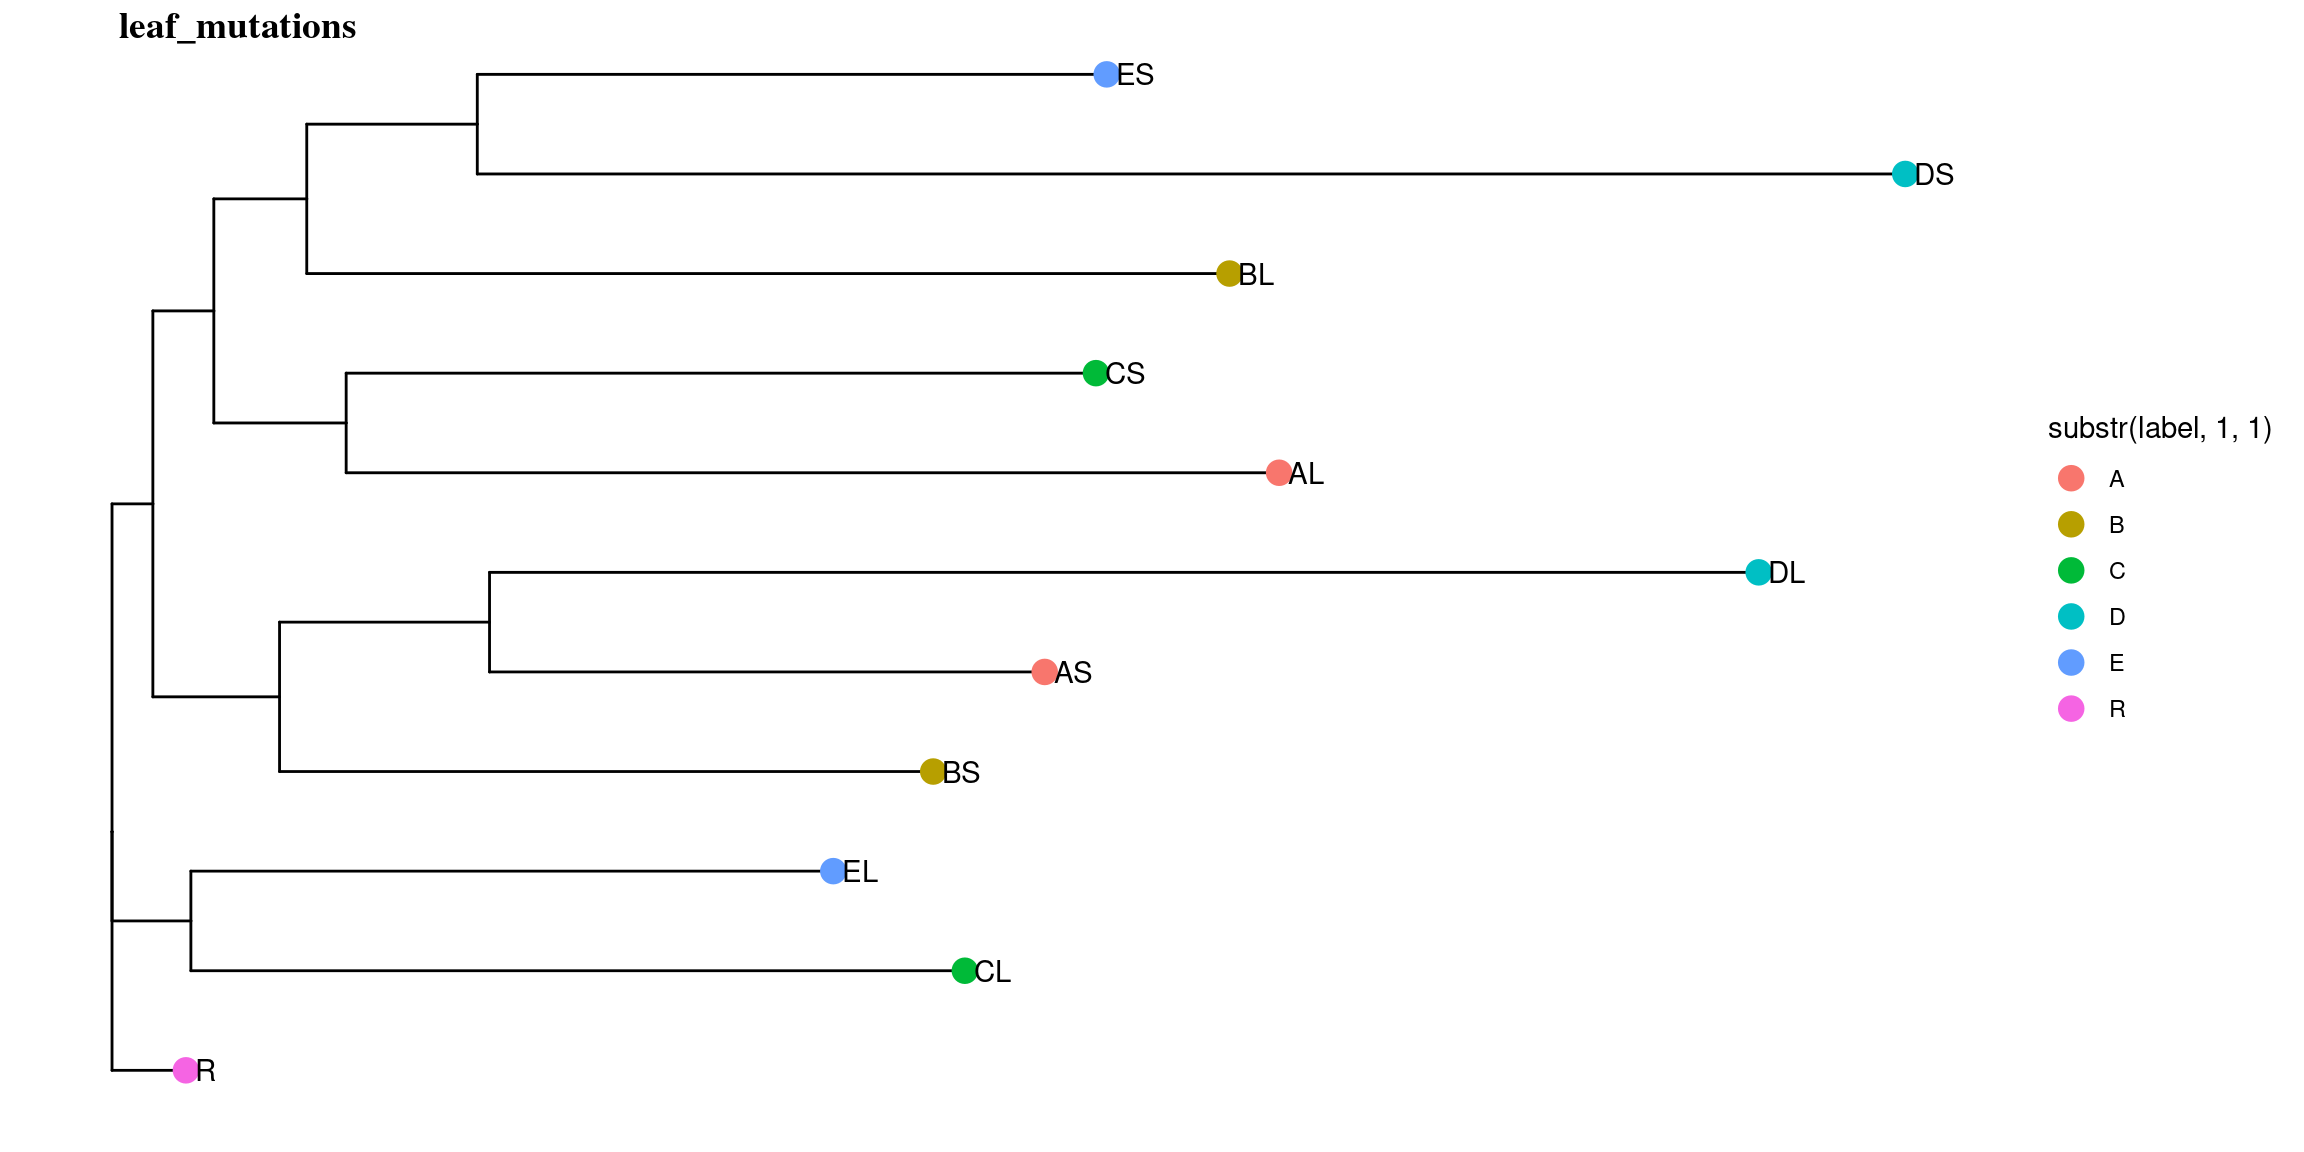
10.5 Leaf mutations
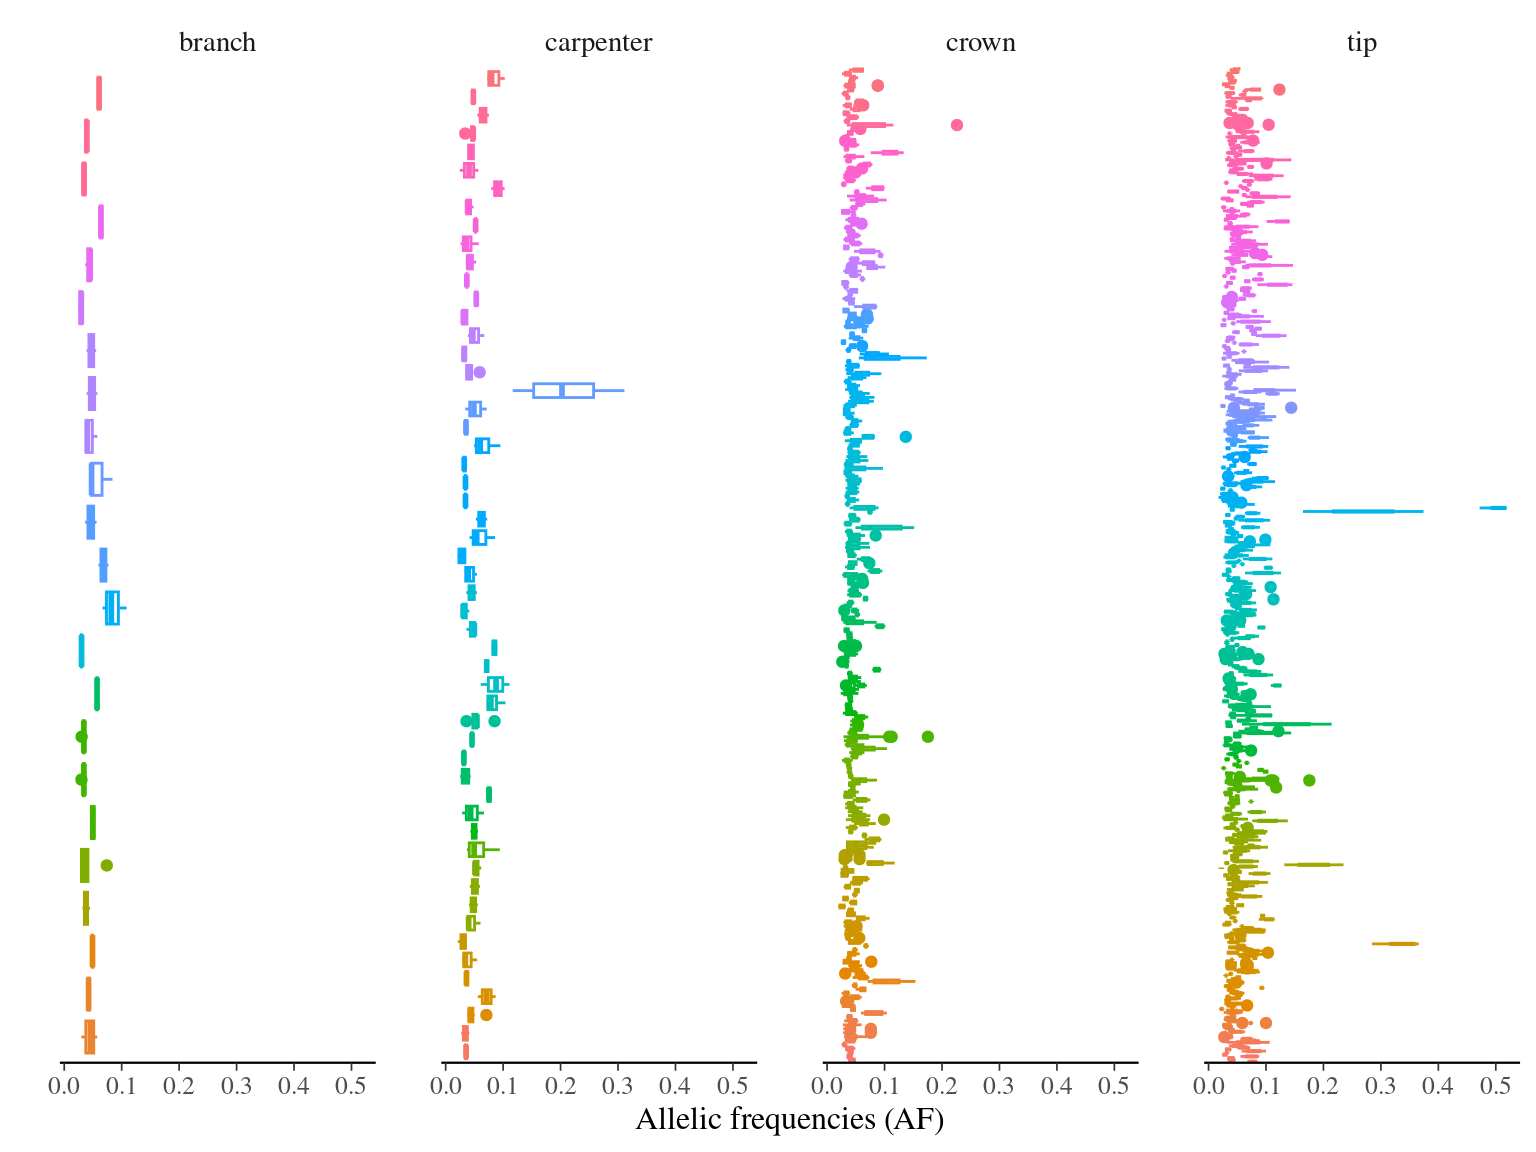
Only 30 to 89 mutations passed evs filtering across samples (Fig. ??). Most of mutations are low frequency (Fig. 10.12). Most of mutations are not shared by biological replicates (Fig. 10.13 and Fig. 10.14).
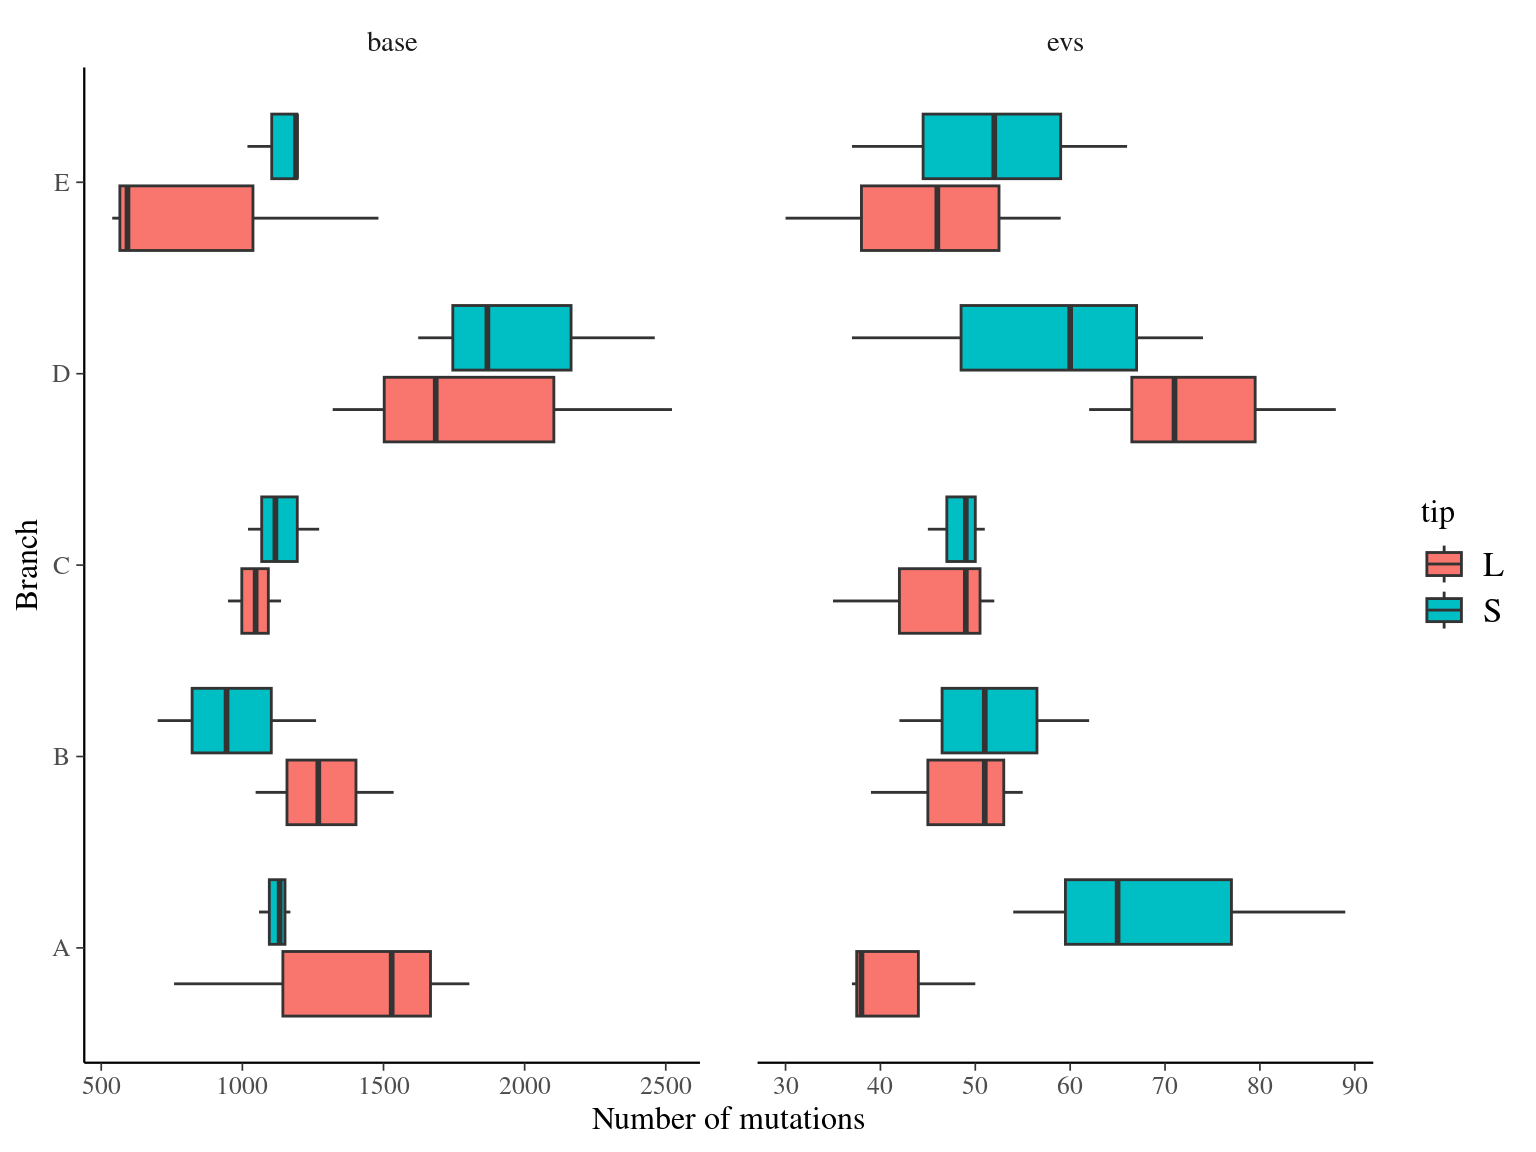
Figure 10.11: Number of filtered mutations per leaf.
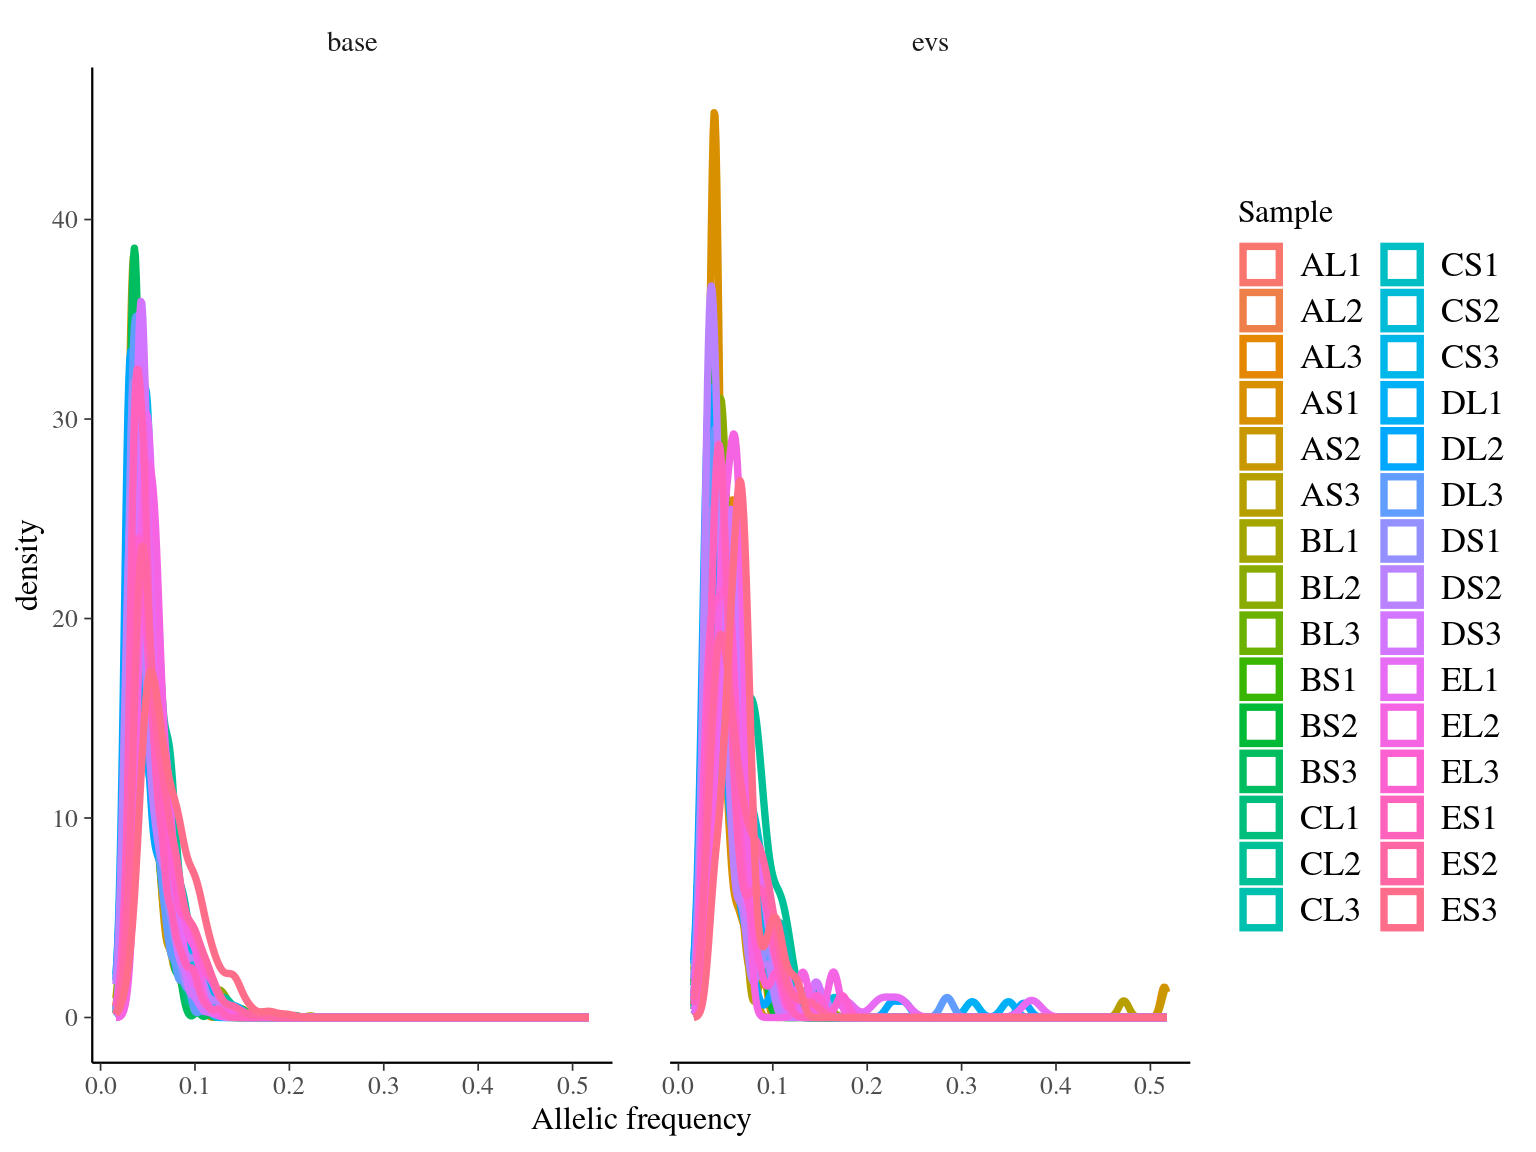
Figure 10.12: Alleles-frequencies of filtered mutations in leaf samples.
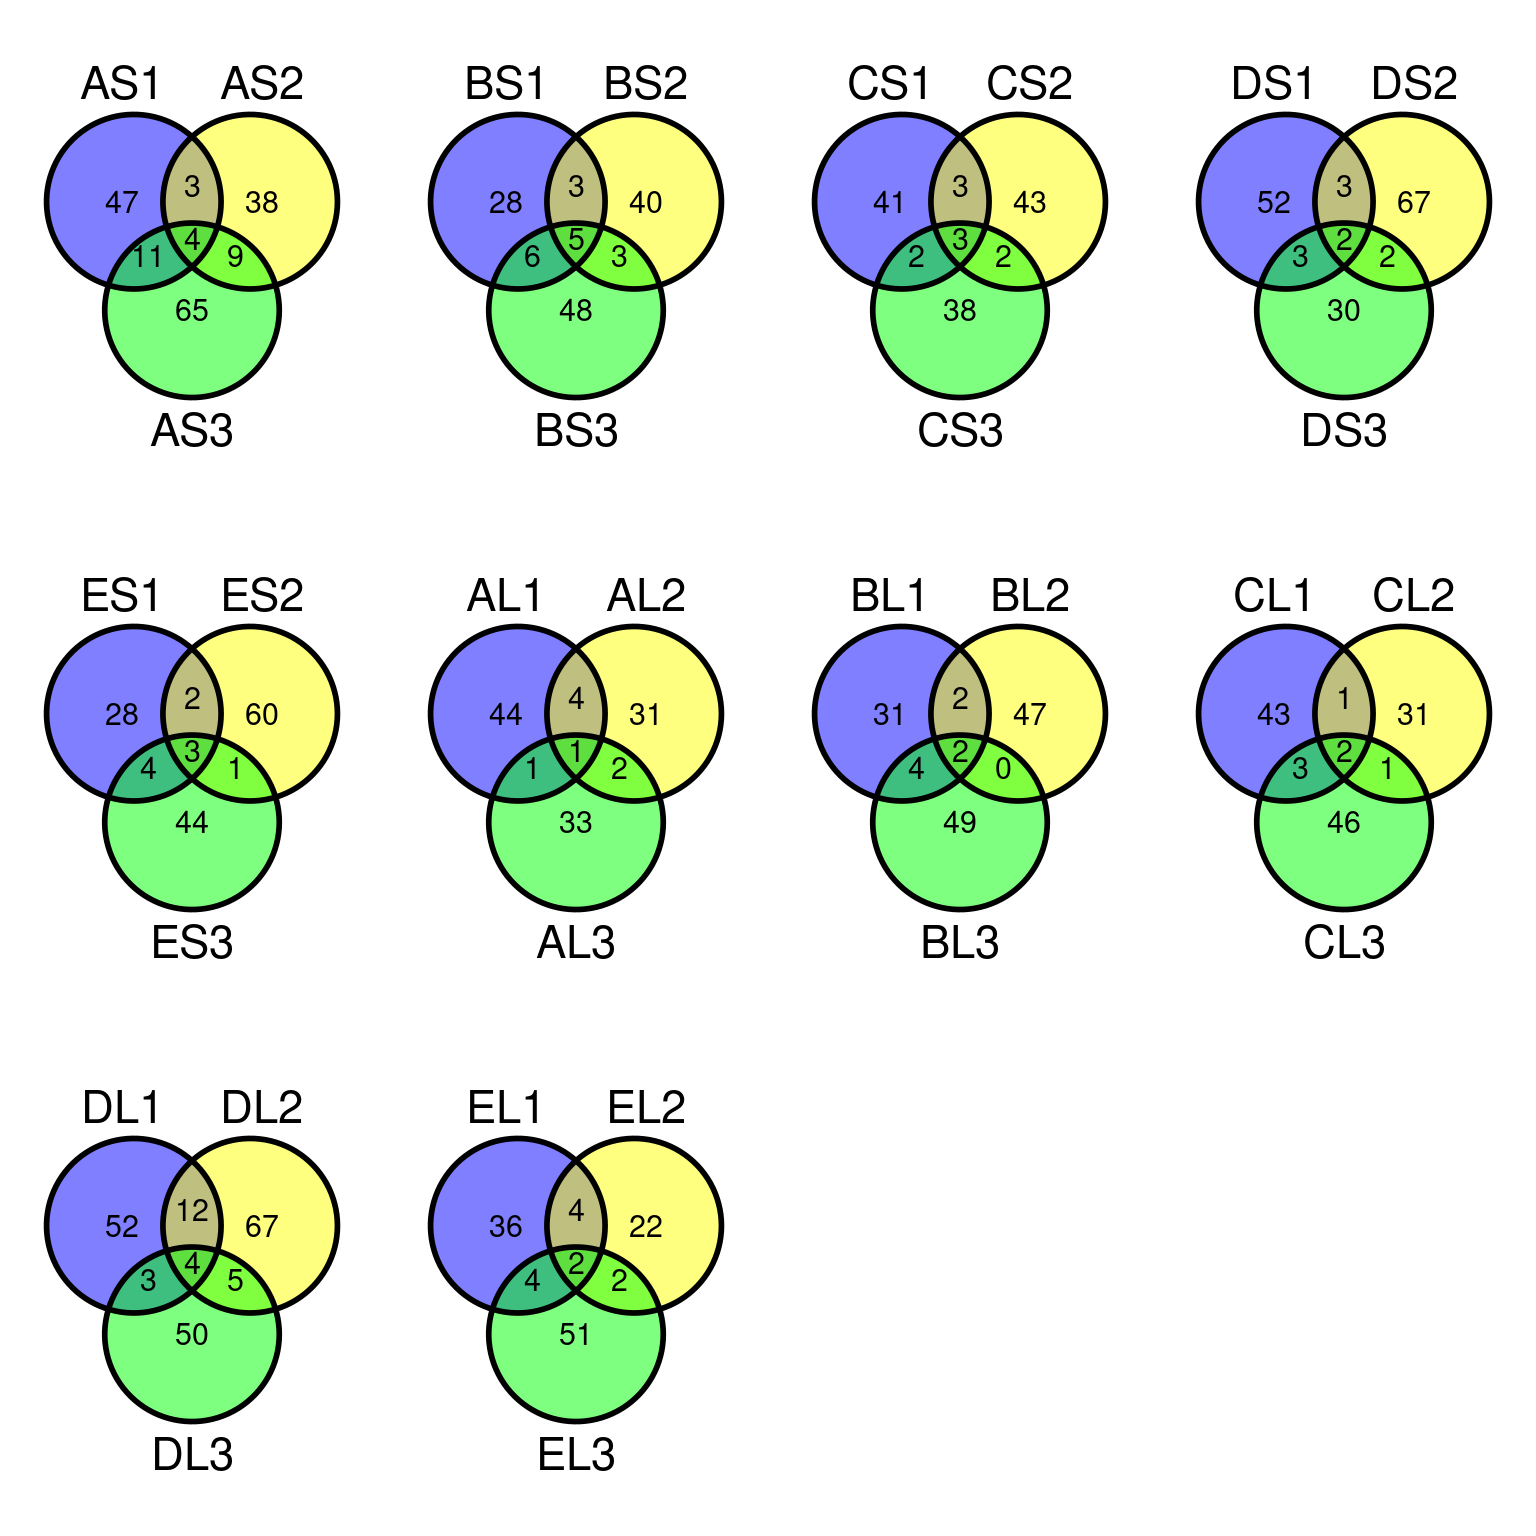
Figure 10.13: Filtered mutations sharing across leaf samples within tips for evs filtering.
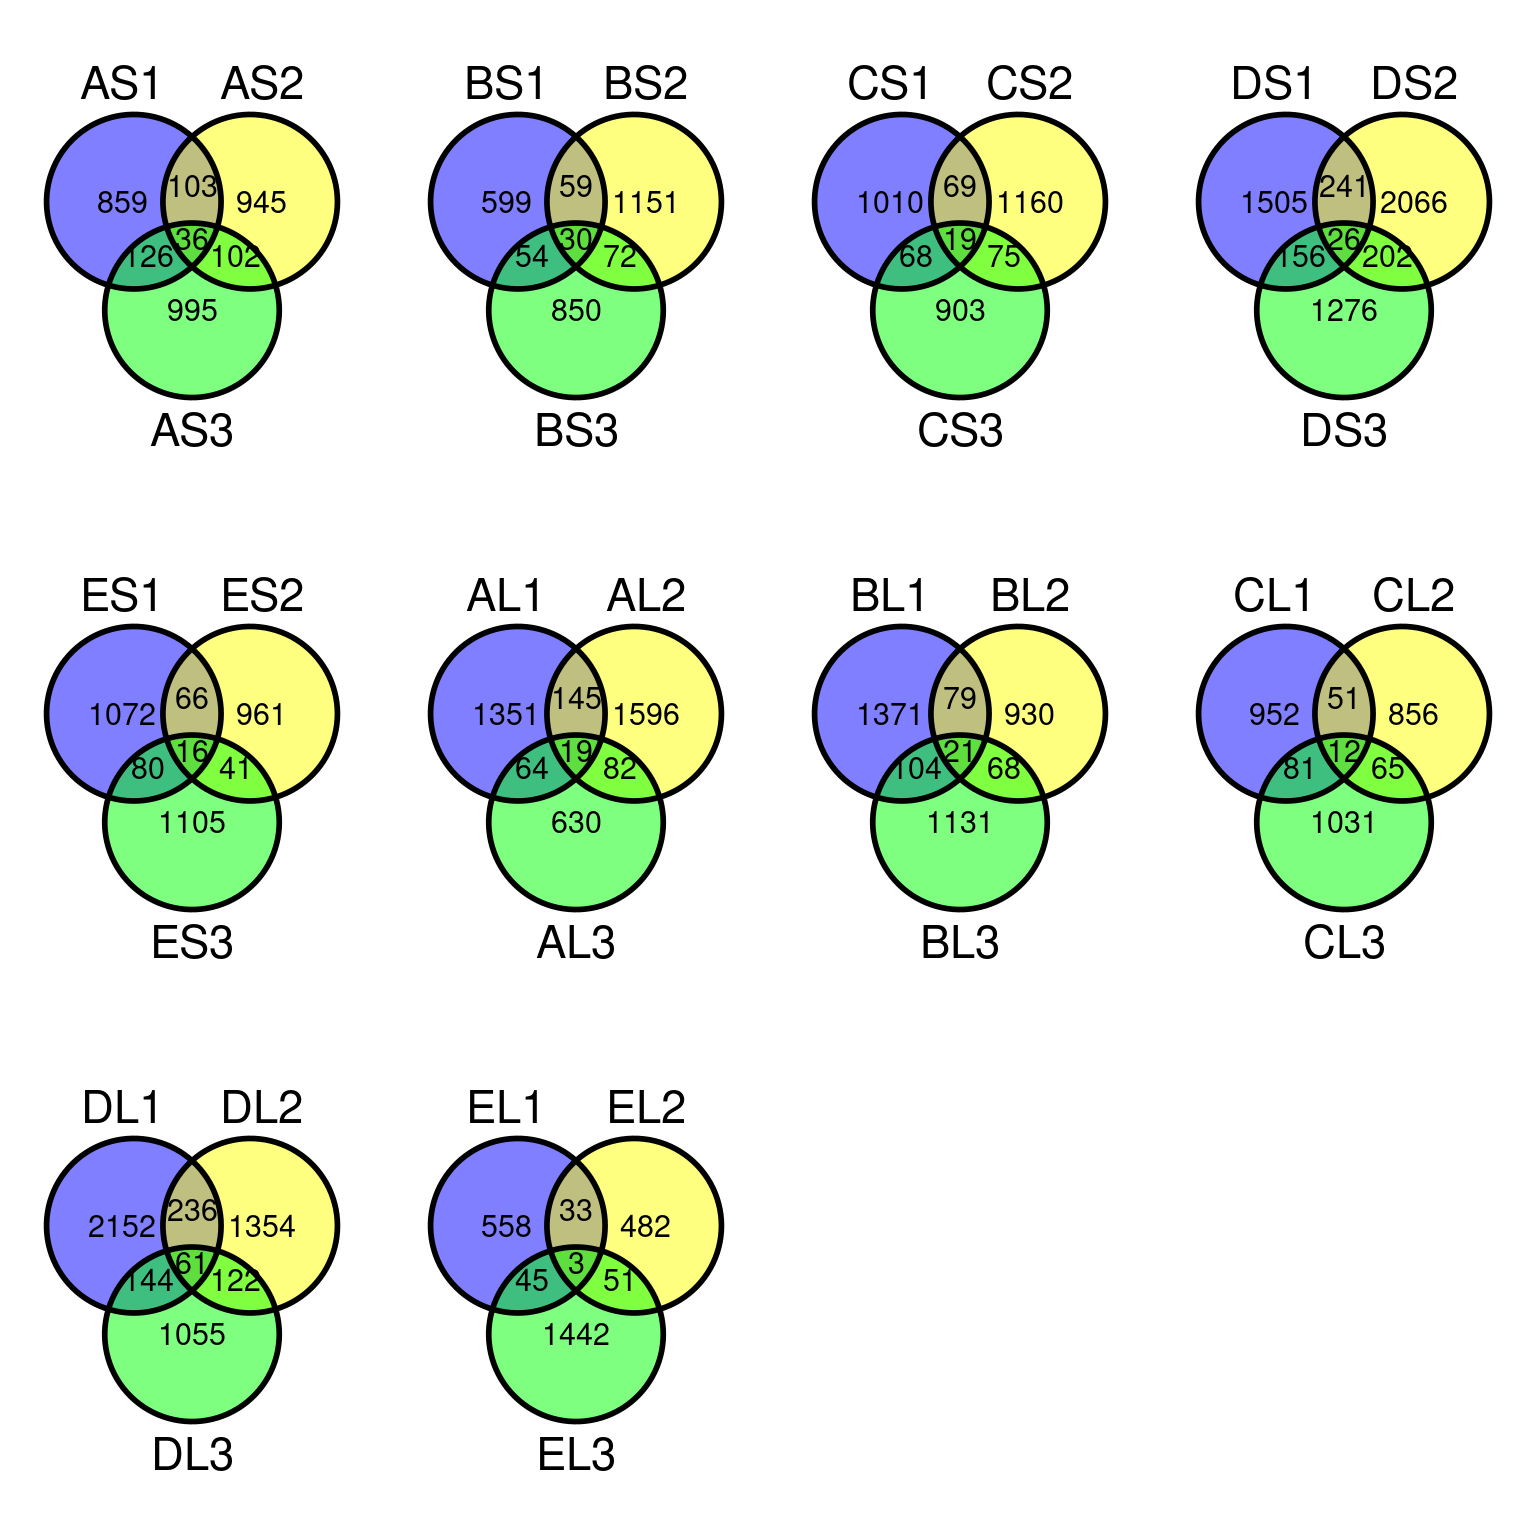
Figure 10.14: Filtered mutations sharing across leaf samples within tips for base filtering.
10.8 Light & annotation
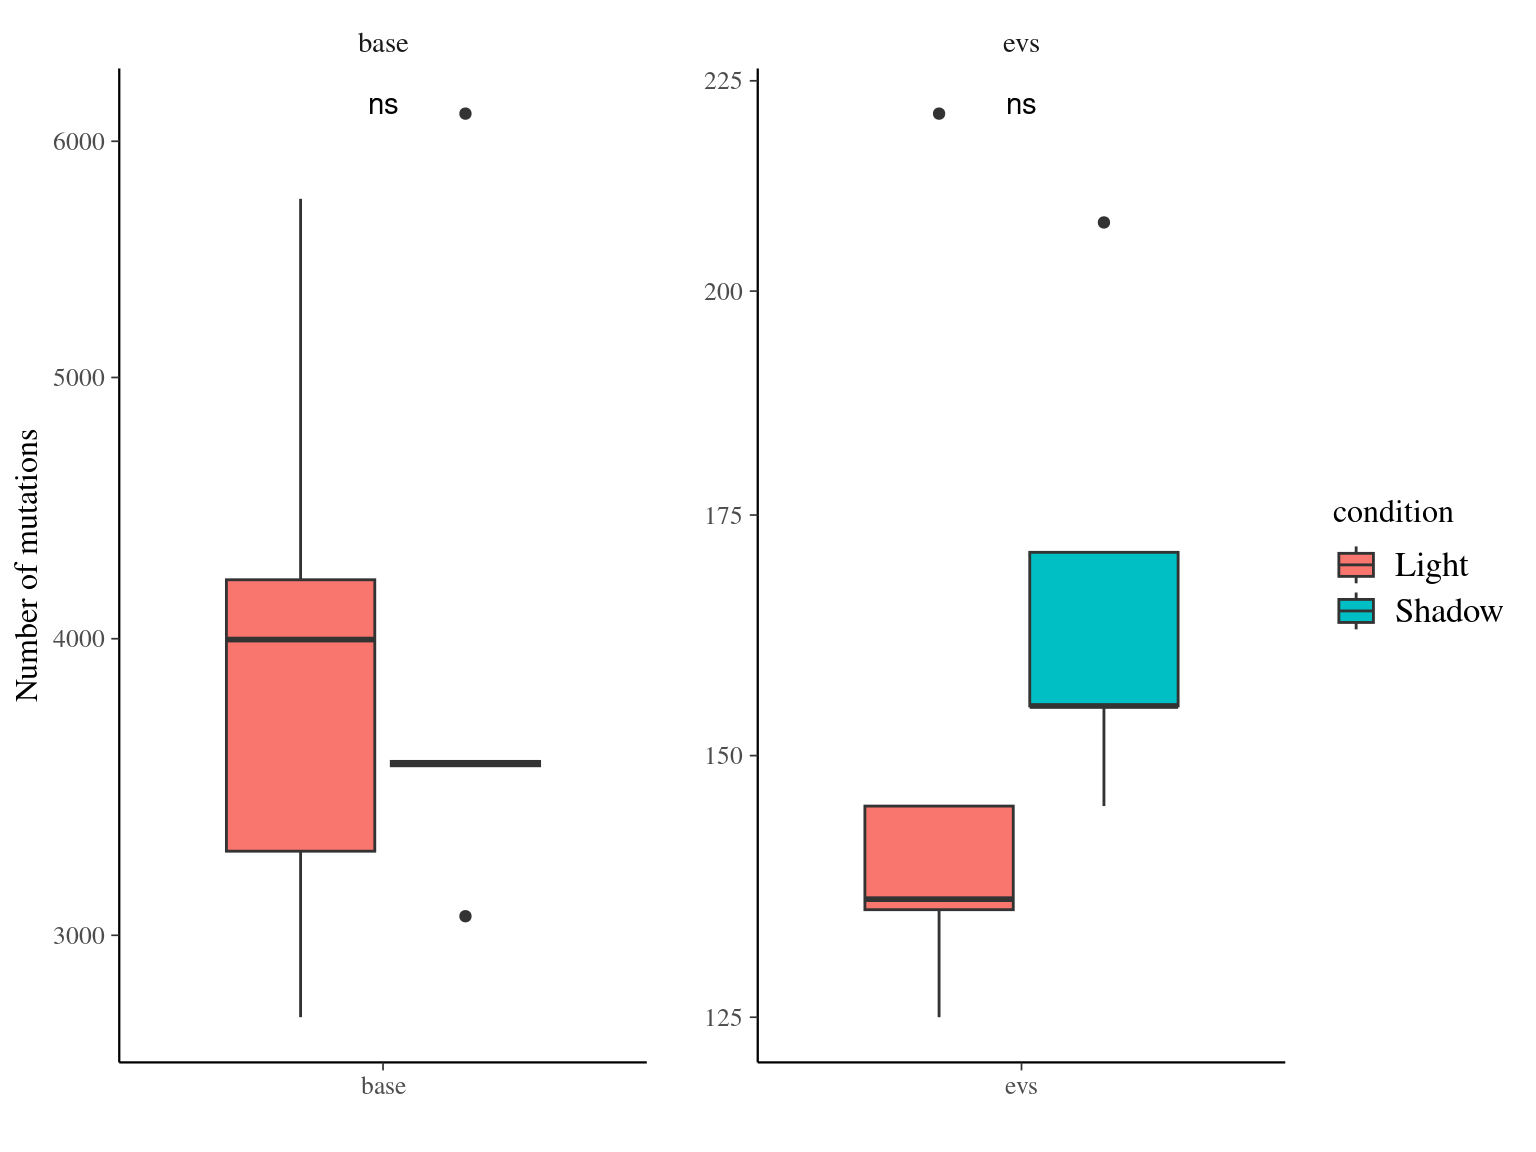
Figure 10.15: Number of mutations per filter and light condition across branches.
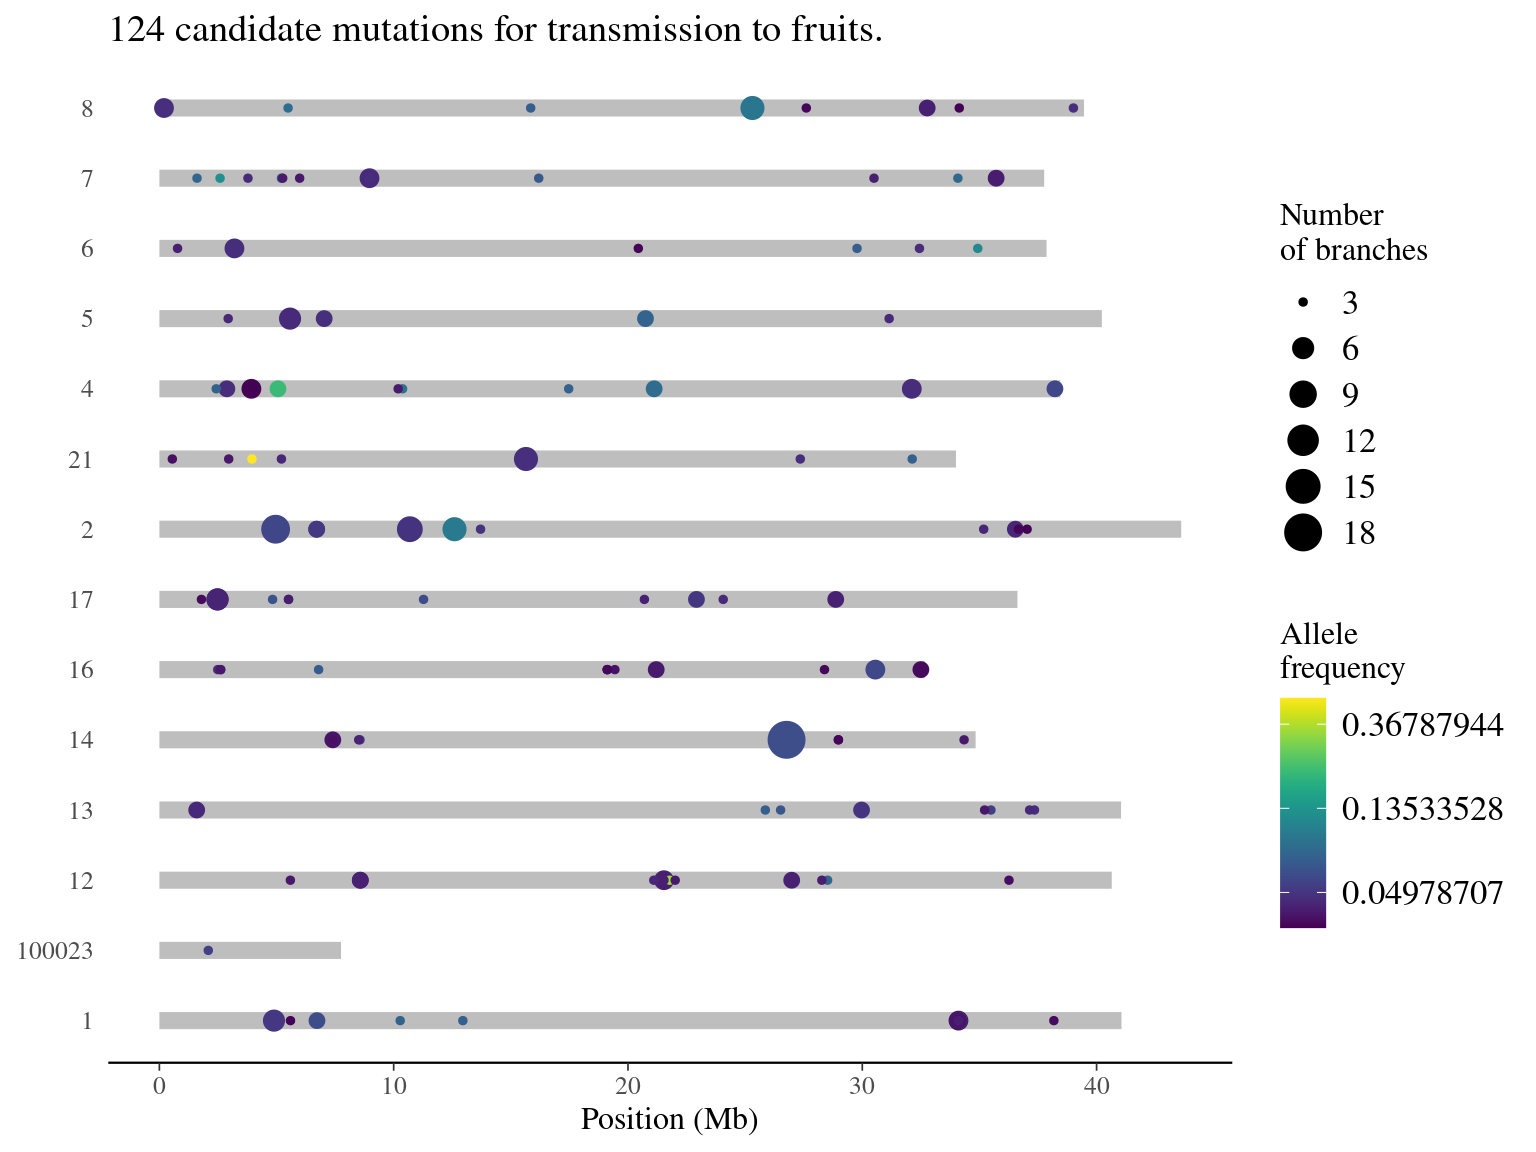
10.10 Mutations for Fruits
Selection of mutations for transmission in fruits.
| replicate | N | minAF | meanAF | maxAF |
|---|---|---|---|---|
| 18 | 1 | 0.06 | 0.06 | 0.06 |
| 10 | 1 | 0.06 | 0.06 | 0.06 |
| 8 | 1 | 0.05 | 0.05 | 0.05 |
| 7 | 3 | 0.05 | 0.08 | 0.10 |
| 6 | 4 | 0.04 | 0.05 | 0.05 |
| 5 | 8 | 0.03 | 0.04 | 0.06 |
| 4 | 26 | 0.04 | 0.06 | 0.21 |
| 3 | 80 | 0.03 | 0.06 | 0.50 |
10.11 Genes
cd data/mutations/angela/annotation
~/Tools/gffread/gffread trsc.fa.transdecoder.gff3 -T -o trsc.fa.transdecoder.gtf
perl ~/Tools/SNPdat_package_v1.0.5/SNPdat_v1.0.5.pl \
  -i SNPsOnTrsc.tsv \
  -g trsc.fa.transdecoder.gtf \
  -f trsc.fa \
  -s synonymy.summary \
  -o synonymy.output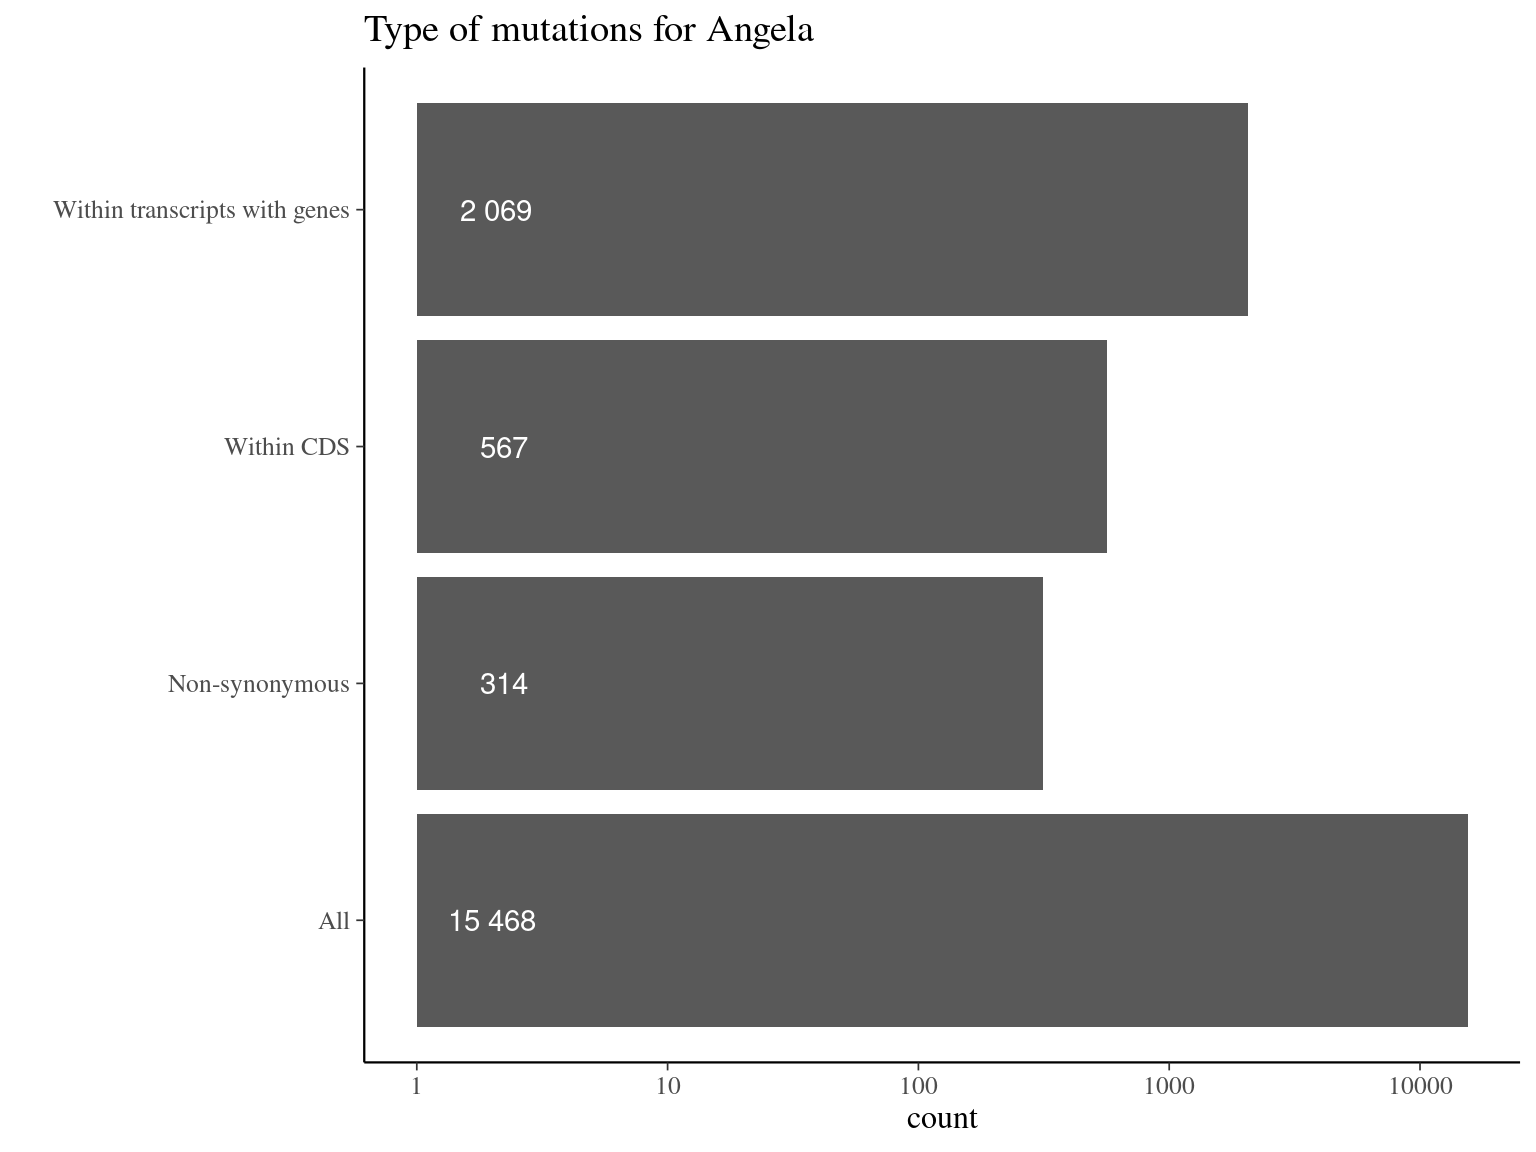
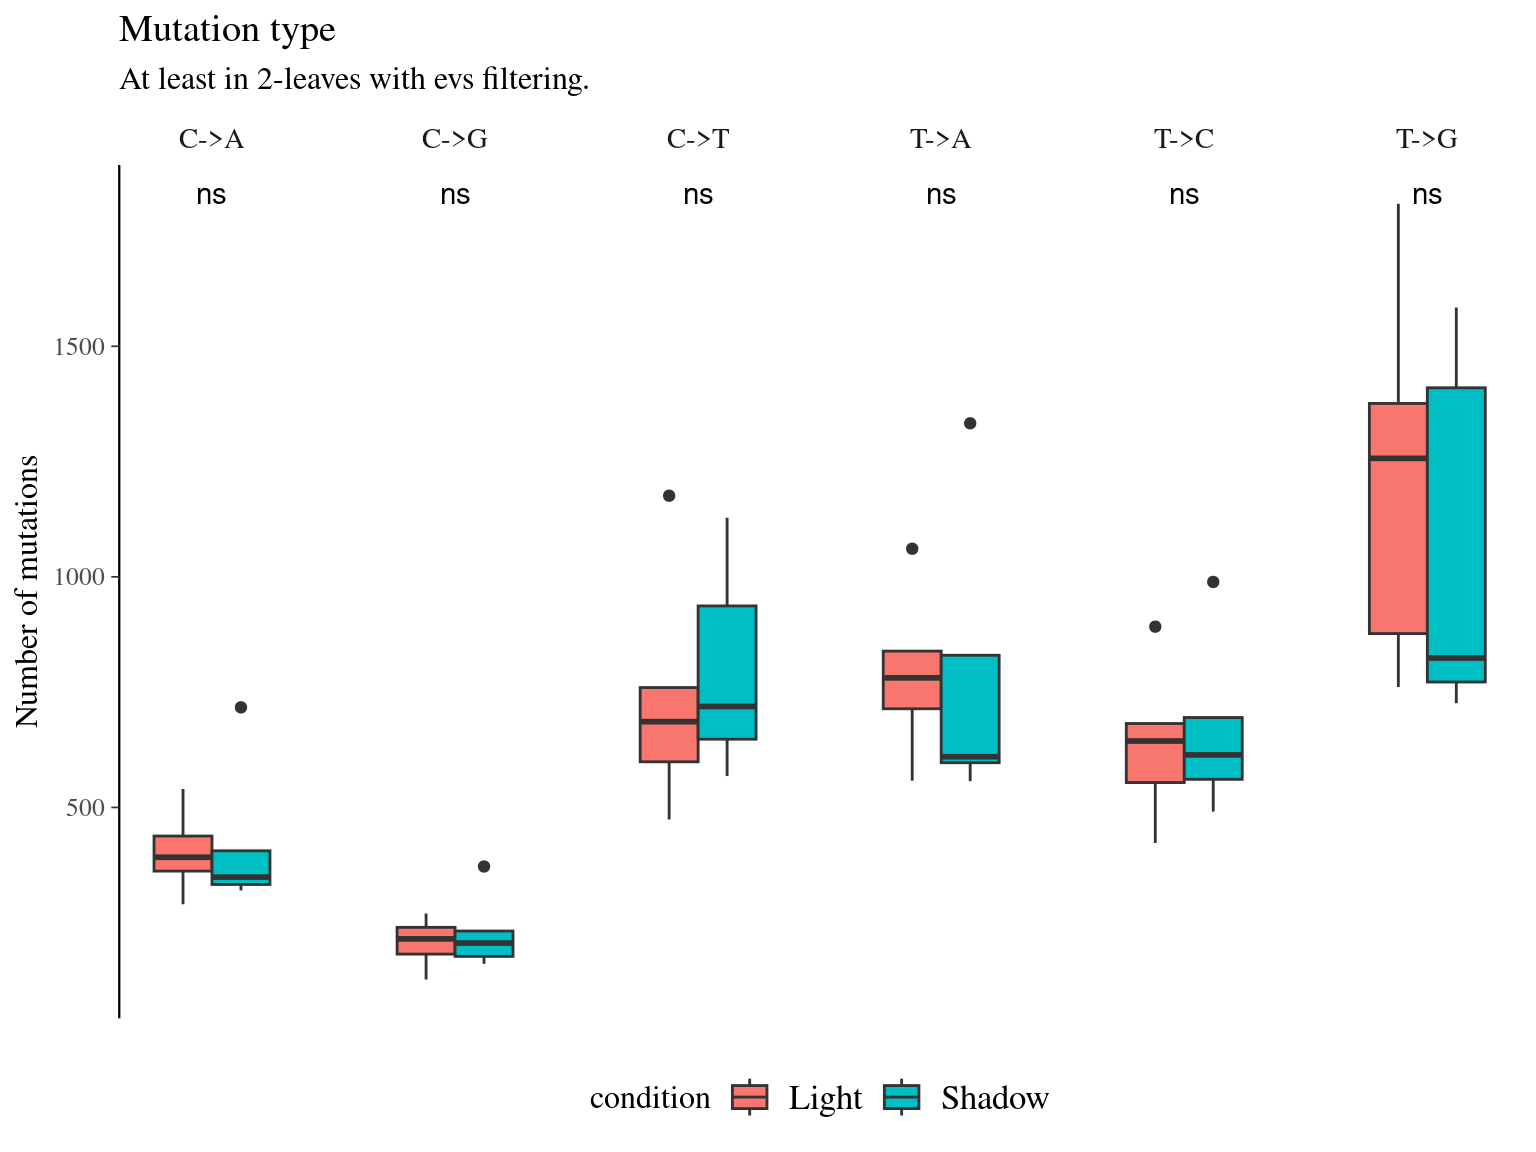
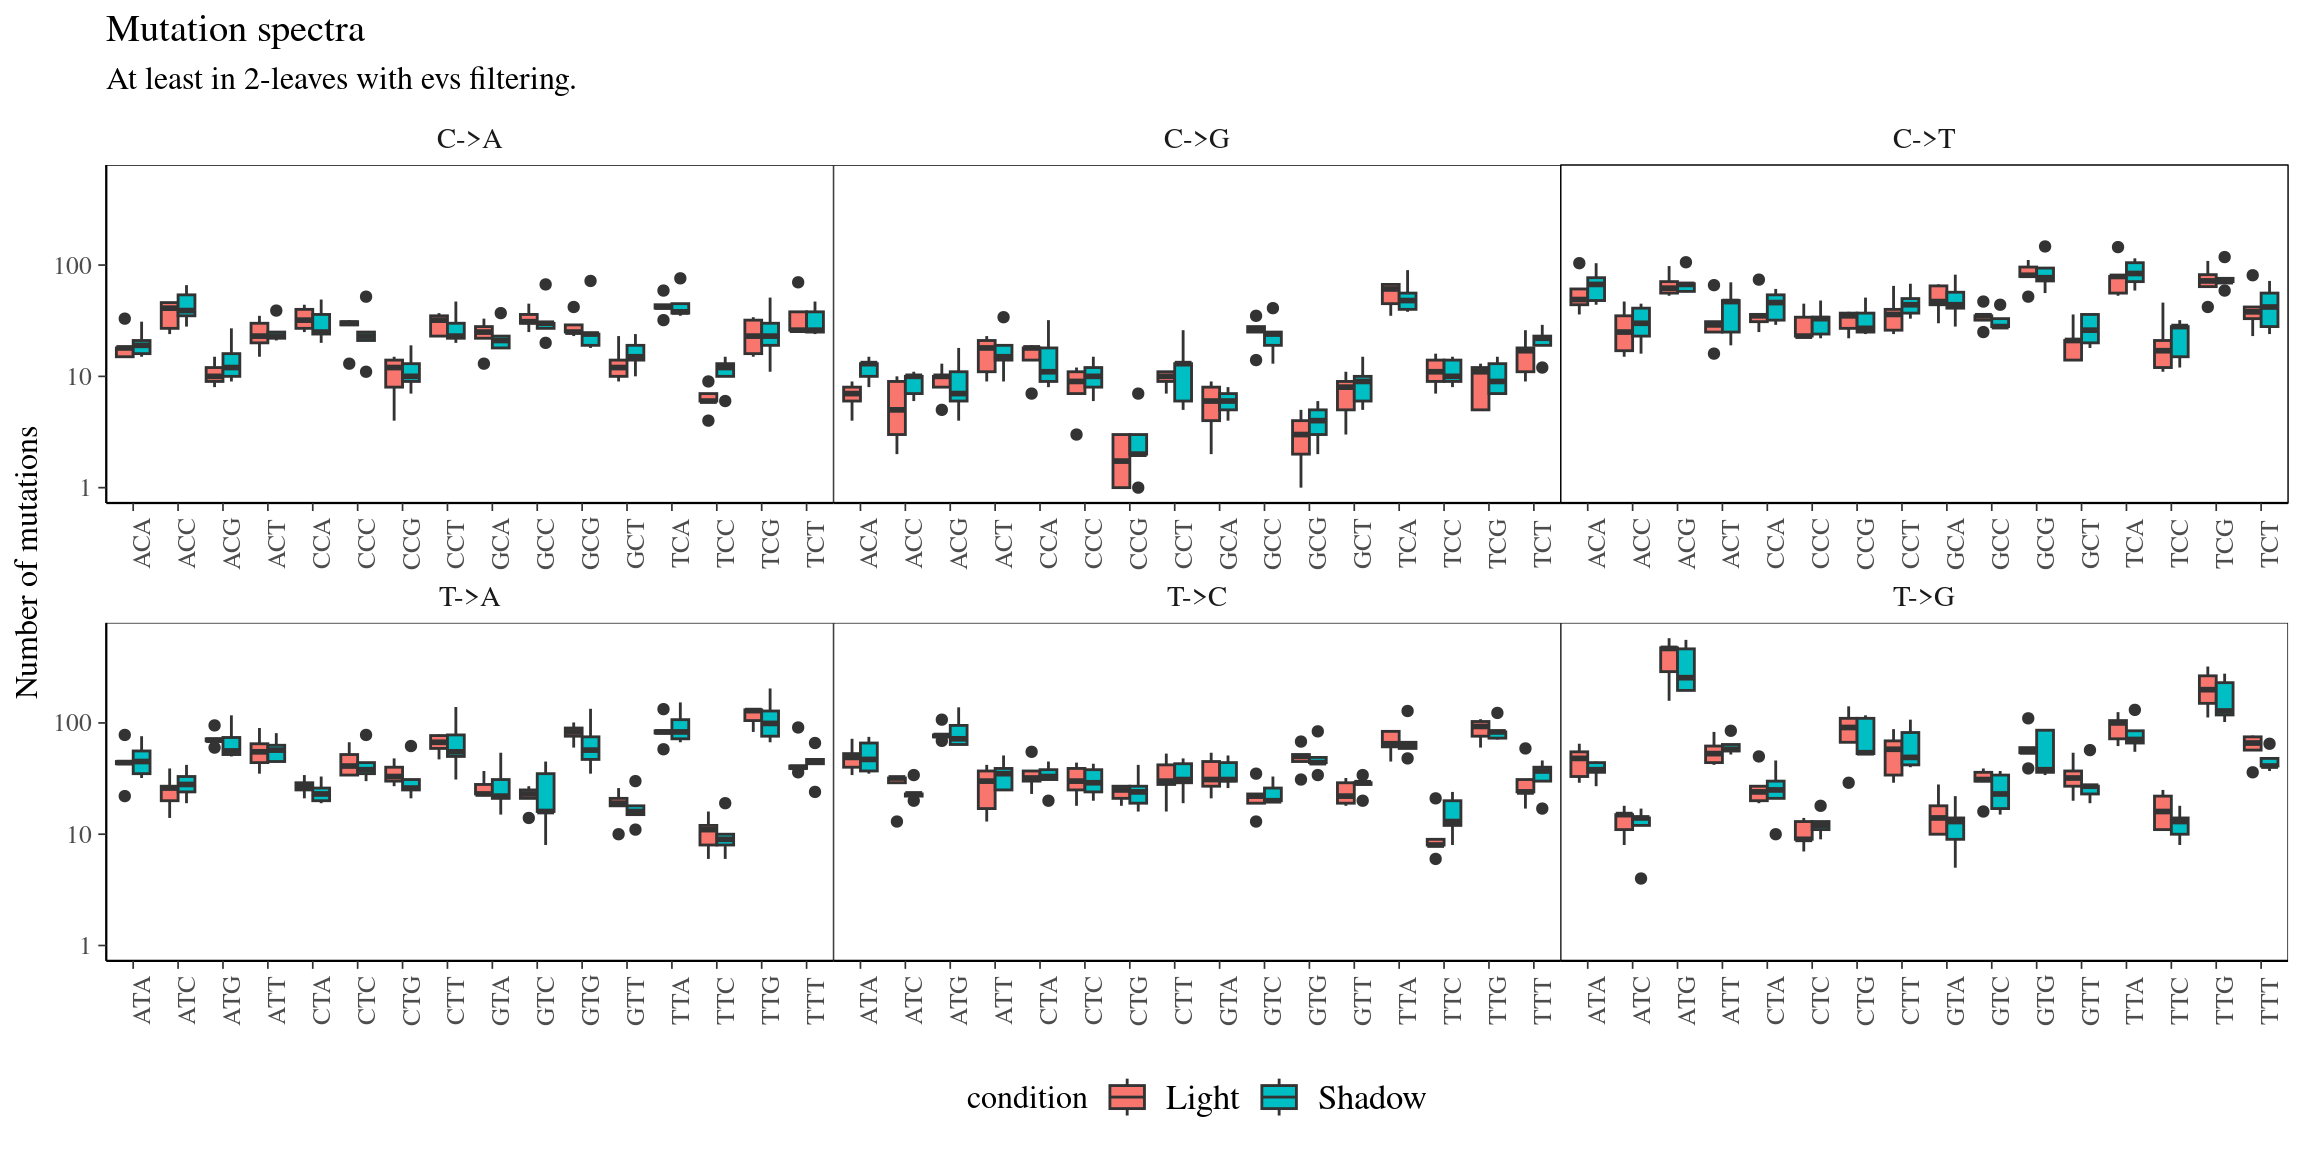
Figure 10.16: Mutations types.
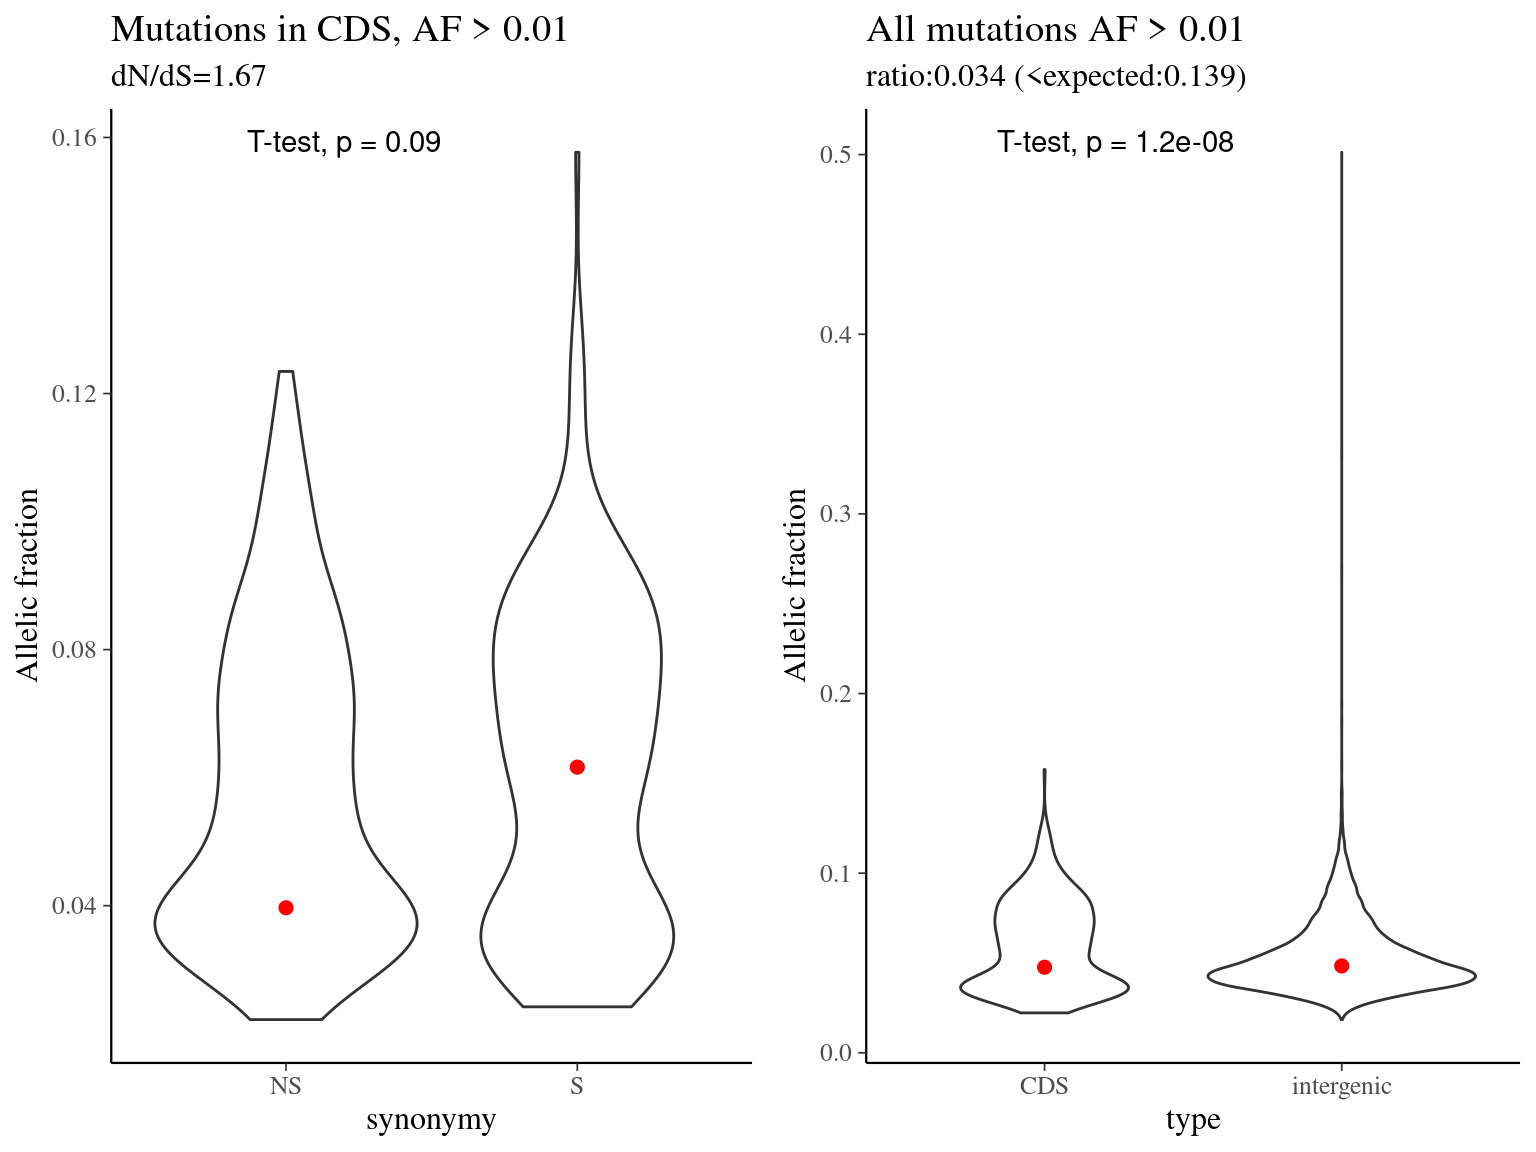
Figure 10.17: Mutation allelic fraction per type.
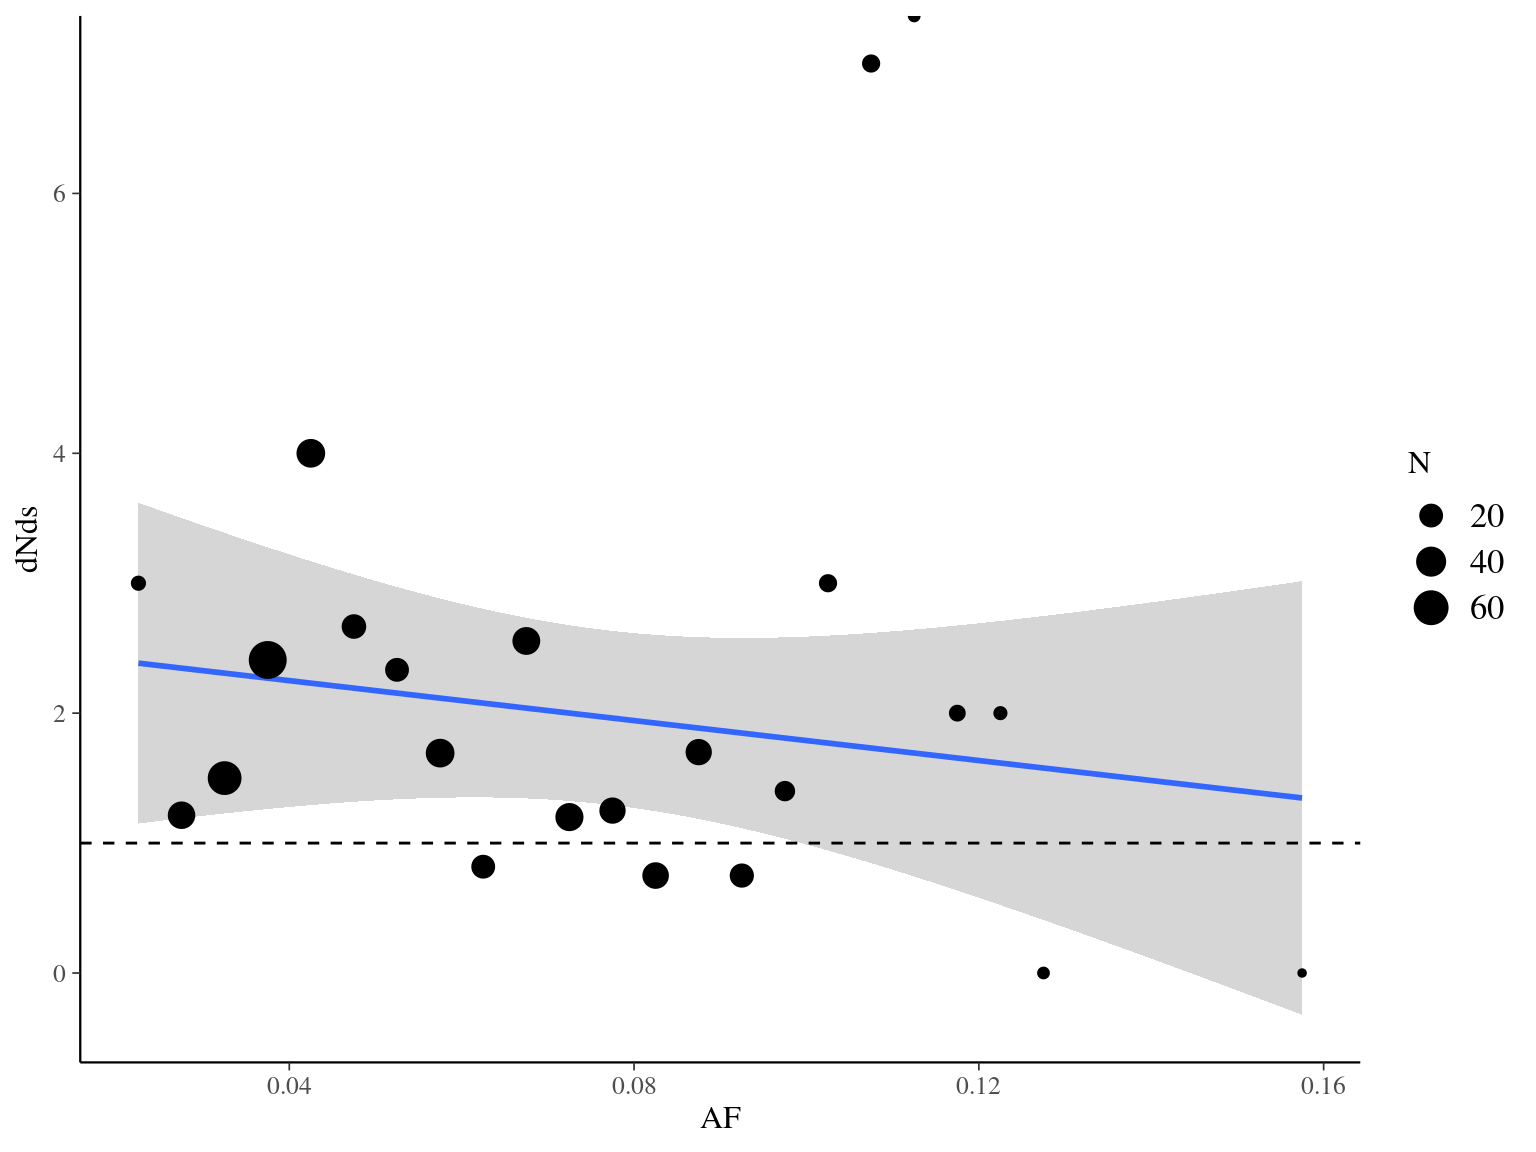
Figure 10.18: Synonymy with allelic fraction.
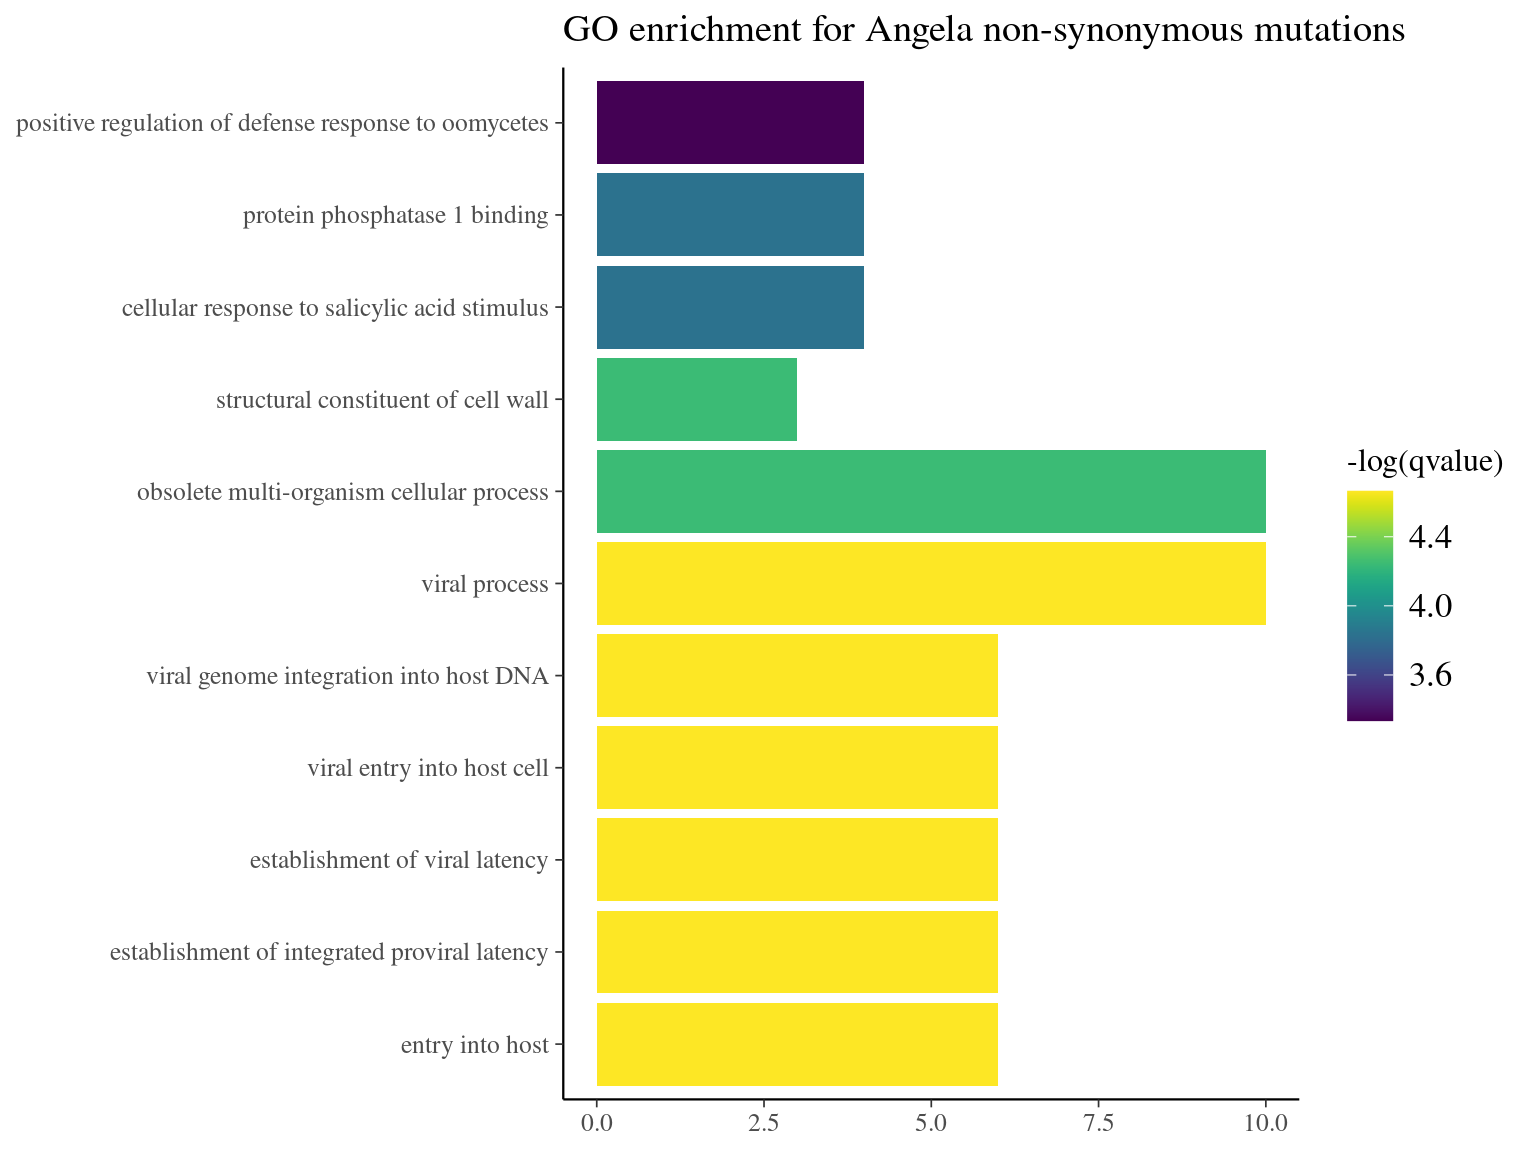
Figure 10.19: GO enrichment for Angela non-synonymous mutations.