Chapter 9 Mutations Bordeaux
This chapter describes the reanalyses of data from Plomion et al. (2018) currently done in the bordeaux branch of the detectMutations repository.
9.1 Original mutations on 3P
I reported the original mutations (Tab. 9.1) from the supplementary table 5 from Plomion et al. (2018) and plotted them on the 3P genome (Fig. 9.1) after realignement from the haplome v2.3 to the public 3P genome.
| locus | Mutation | origin | f(alt)pool | CHROM | POS |
|---|---|---|---|---|---|
| Sc0000080_1329750 | G/A | 3P – between XL1 and XL2 | 0,0330 | Qrob_Chr08 | 58757092 |
| Sc0000573_185294 | A/T | 3P – between XL1 and XL2 | 0,0000 | Qrob_H2.3_Sc0000573 | 185294 |
| Sc0000010_1057132 | G/A | 3P – between XL1 and XL2 | 0,1154 | Qrob_Chr03 | 13766652 |
| Sc0000003_4011526 | A/T | 3P – between XL1 and XL2 | 0,0000 | Qrob_Chr02 | 84928601 |
| Sc0000010_758473 | G/A | 3P – between XL1 and XL2 | 0,0000 | Qrob_Chr03 | 13467993 |
| Sc0000015_2644541 | G/T | 3P – between XL1 and XL2 | 0,0000 | Qrob_Chr03 | 50836623 |
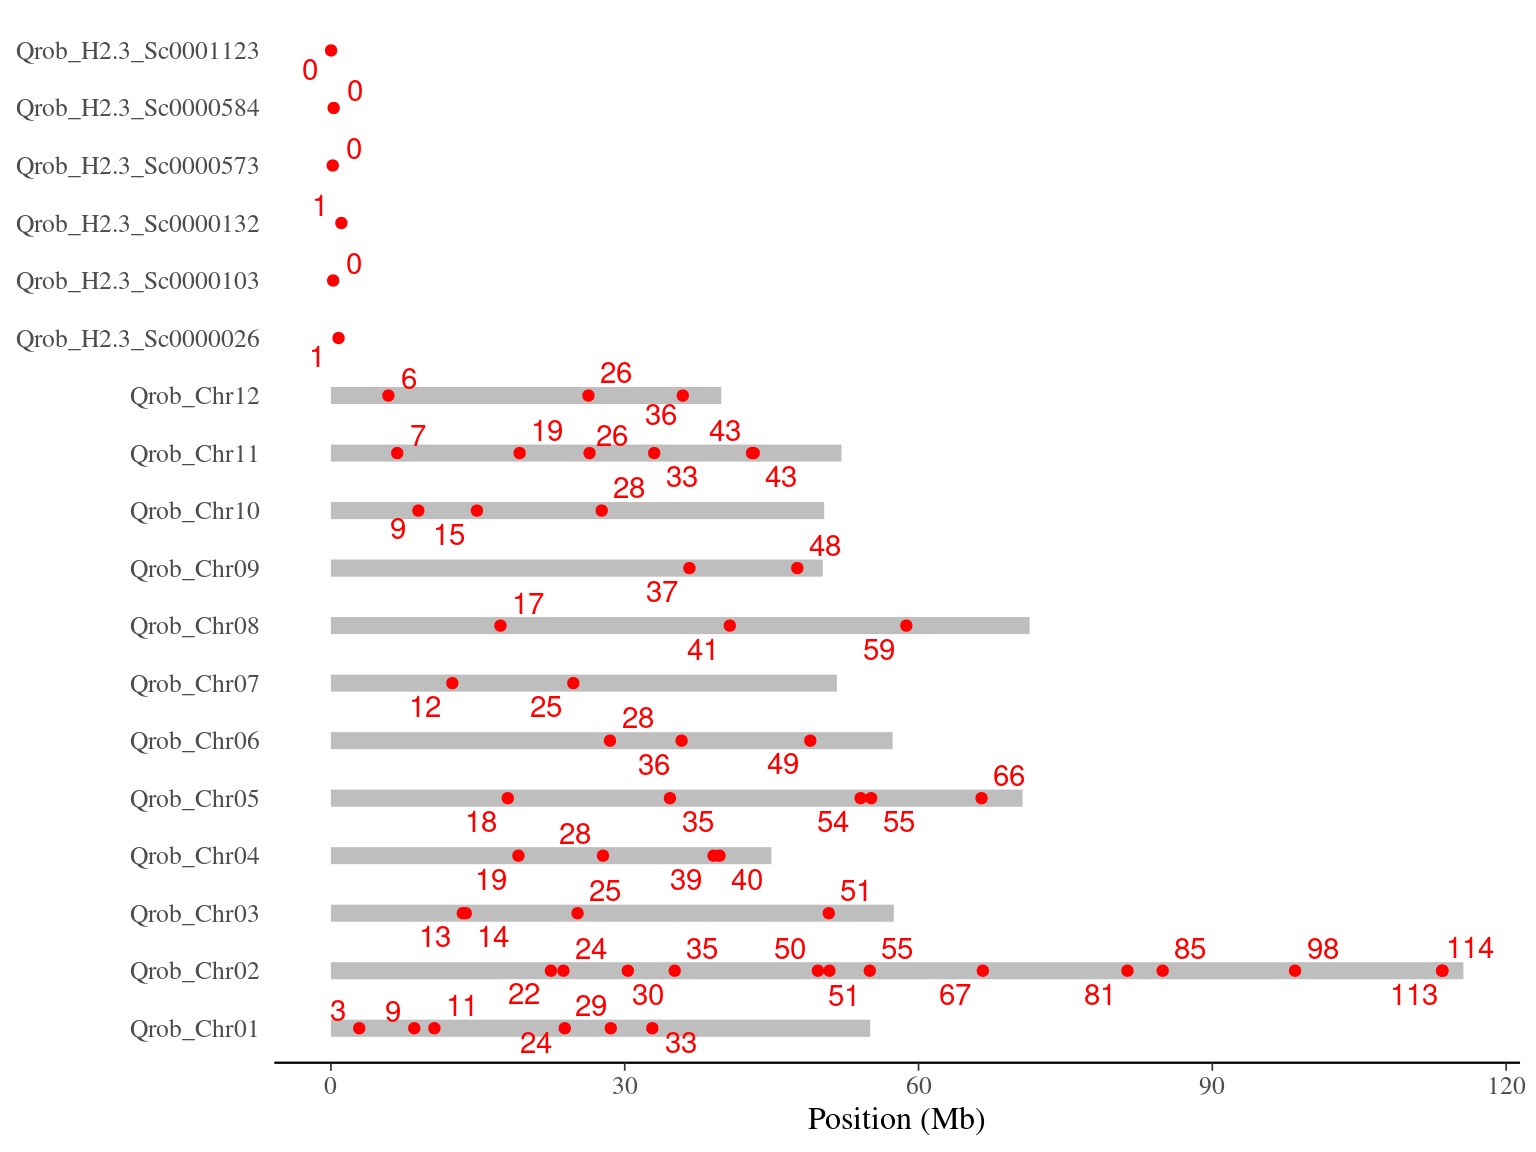
Figure 9.1: Original mutations on the 3P genome.
9.2 Coverage
Coverage are around 160X, this is high but strangely lower than expected, besides all data have been used this time. (Fig. 9.2).
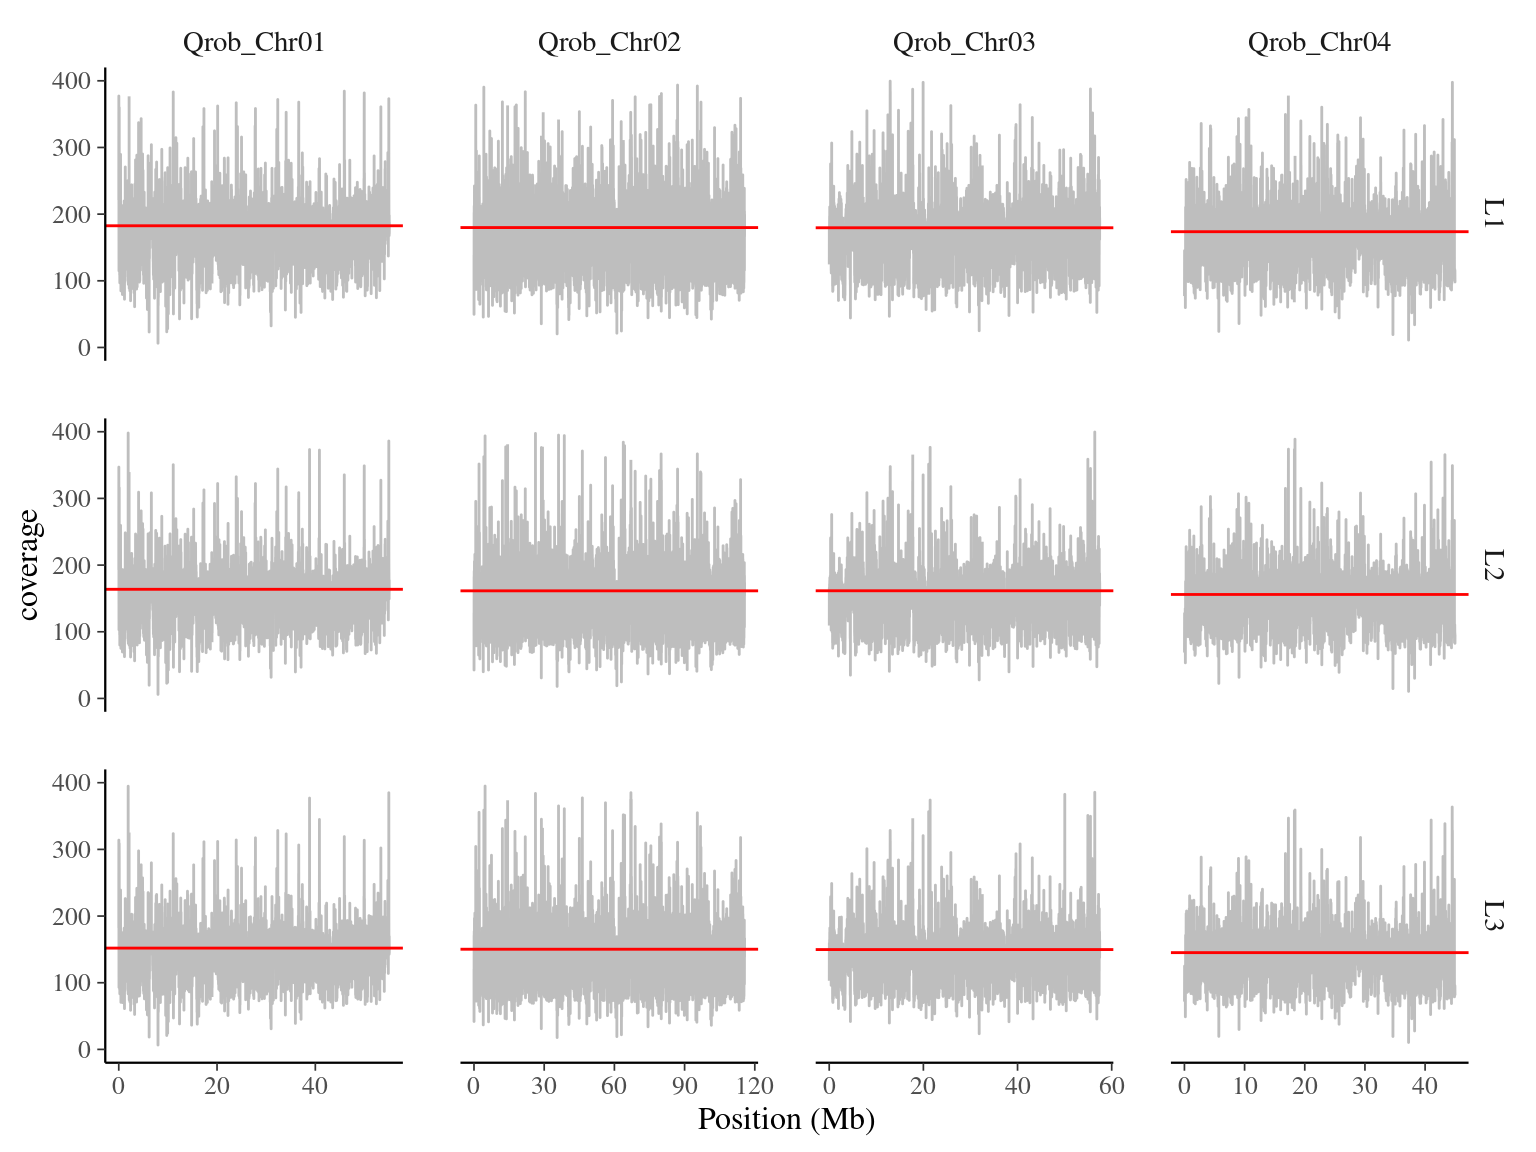
Figure 9.2: Coverage for Bordeaux’s libraries on chromosomes 1 to 4.
9.3 Strelka2
Strelka2 produced 3 millions of candidate mutations with unique position across the 3 branches.
9.3.1 Overlap with original mutations
We found back all the 60 expected mutations (100%) (Tab. 9.2).
| Chromosome | Position | Mutated | Normal | Ref | Alt | Mutated AltCount | Mutated RefCount | Normal AltCount | Normal RefCount | Allelic fraction |
|---|---|---|---|---|---|---|---|---|---|---|
| Qrob_Chr08 | 58757092 | L1 | L2 | G | C | 0 | 119 | 0 | 60 | 0.0000000 |
| Qrob_Chr08 | 58757092 | L2 | L1 | G | A | 42 | 60 | 0 | 119 | 0.4117647 |
| Qrob_Chr08 | 58757092 | L1 | L3 | G | C | 0 | 119 | 0 | 60 | 0.0000000 |
| Qrob_Chr08 | 58757092 | L3 | L1 | G | A | 34 | 60 | 0 | 119 | 0.3617021 |
| Qrob_H2.3_Sc0000573 | 185294 | L2 | L1 | A | T | 14 | 57 | 0 | 86 | 0.1971831 |
| Qrob_H2.3_Sc0000573 | 185294 | L1 | L3 | A | T | 0 | 86 | 19 | 50 | 0.0000000 |
9.3.2 Filtering
We filtered mutations with the original and a robust filters, adjusting the coverage to the coverage obtained:
Original:
- A read depth for the two sample between half and two times the mean coverage (
normal_DP <= 320, normal_DP >= 80, mutation_DP <= 320, mutation_DP >= 80) - A null number of alternate allele count in the normal sample (
normal_altCount == 0) - A minimum of 10 alternate allele count in the mutated sample (
mutation_altCount >= 10) - An allelic frequency inferior to 0.5 (
tumor_AF <= 0.5) - A coherent temporal pattern (“XL1-XL2”, “XL2-L3”, “XL1-L1”, “XL2-L2”)
Robust:
- A read depth for the two sample between half and two times the mean coverage (
normal_DP <= 320, normal_DP >= 80, mutation_DP <= 320, mutation_DP >= 80) - A null number of alternate allele count in the normal sample (
normal_altCount == 0) - A minimum of 10 alternate allele count in the mutated sample (
mutation_altCount >= 10) - An allelic frequency inferior to 0.5 (
tumor_AF <= 0.5) Strelka 2automatic filtering (Filter == PASS)- A coherent temporal pattern (“XL1-XL2”, “XL2-L3”, “XL1-L1”, “XL2-L2”)
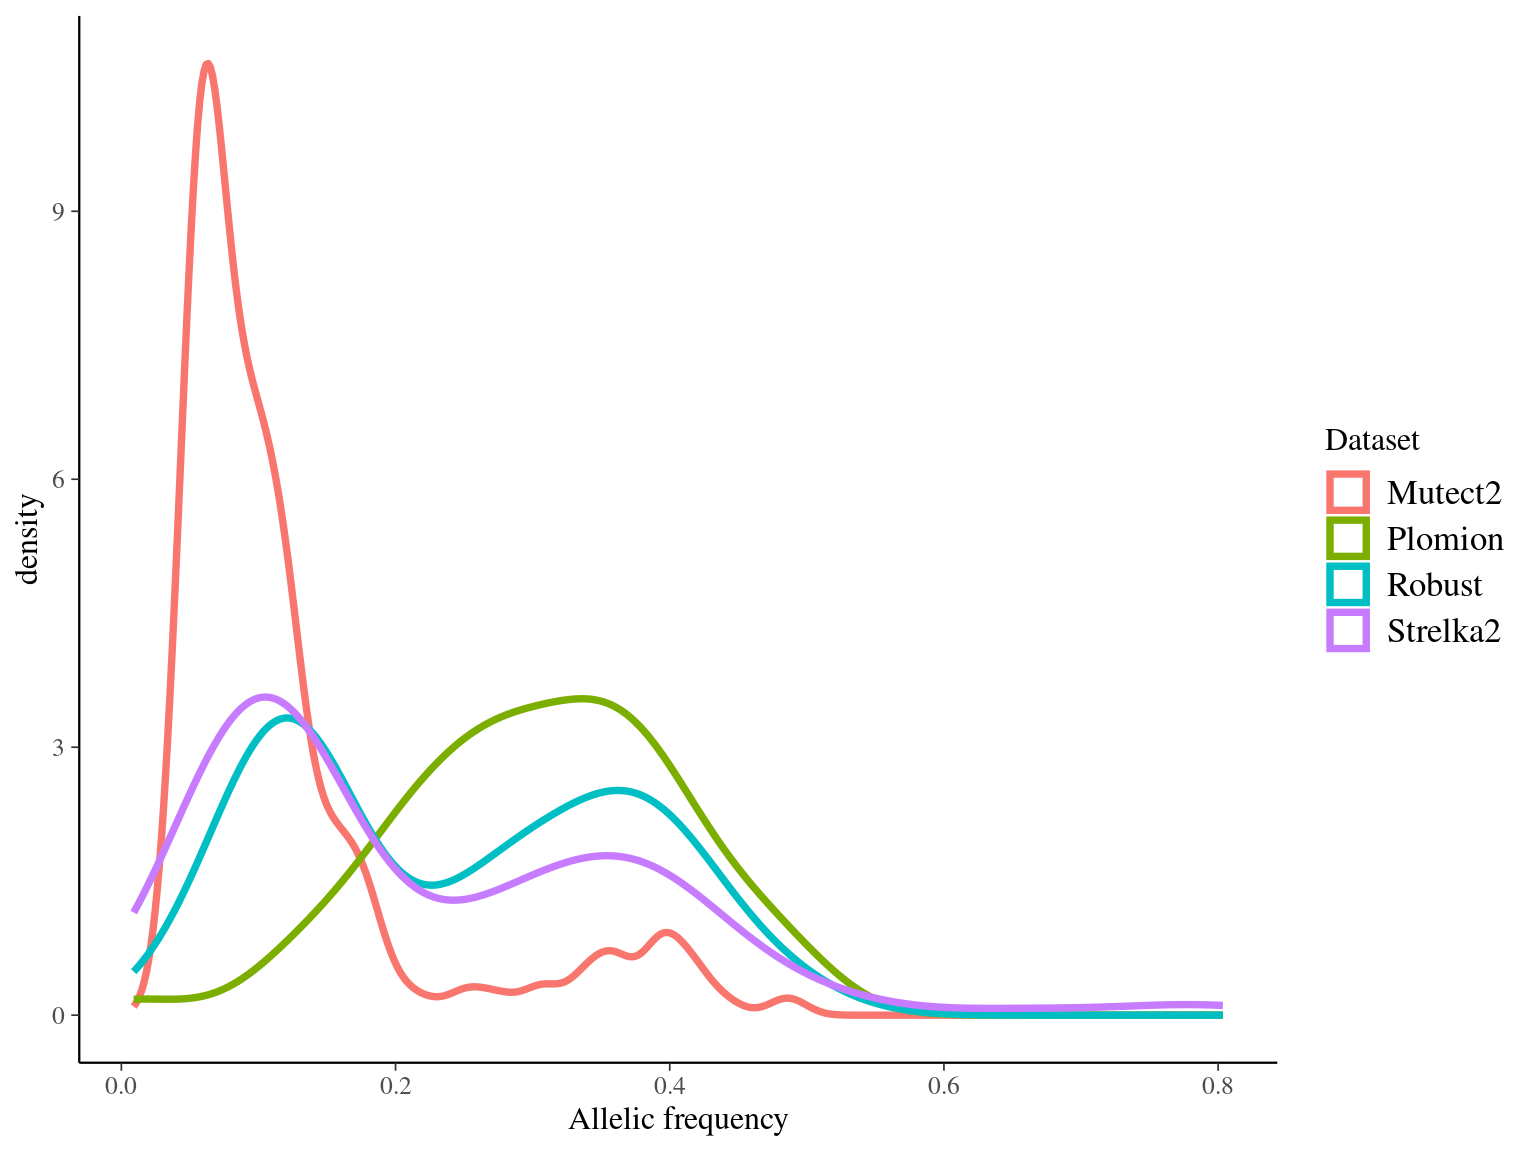
We obtained 460 candidates (Fig 9.3) for the original filter, And in a robust dataset of 108 mutations (Fig 9.4).
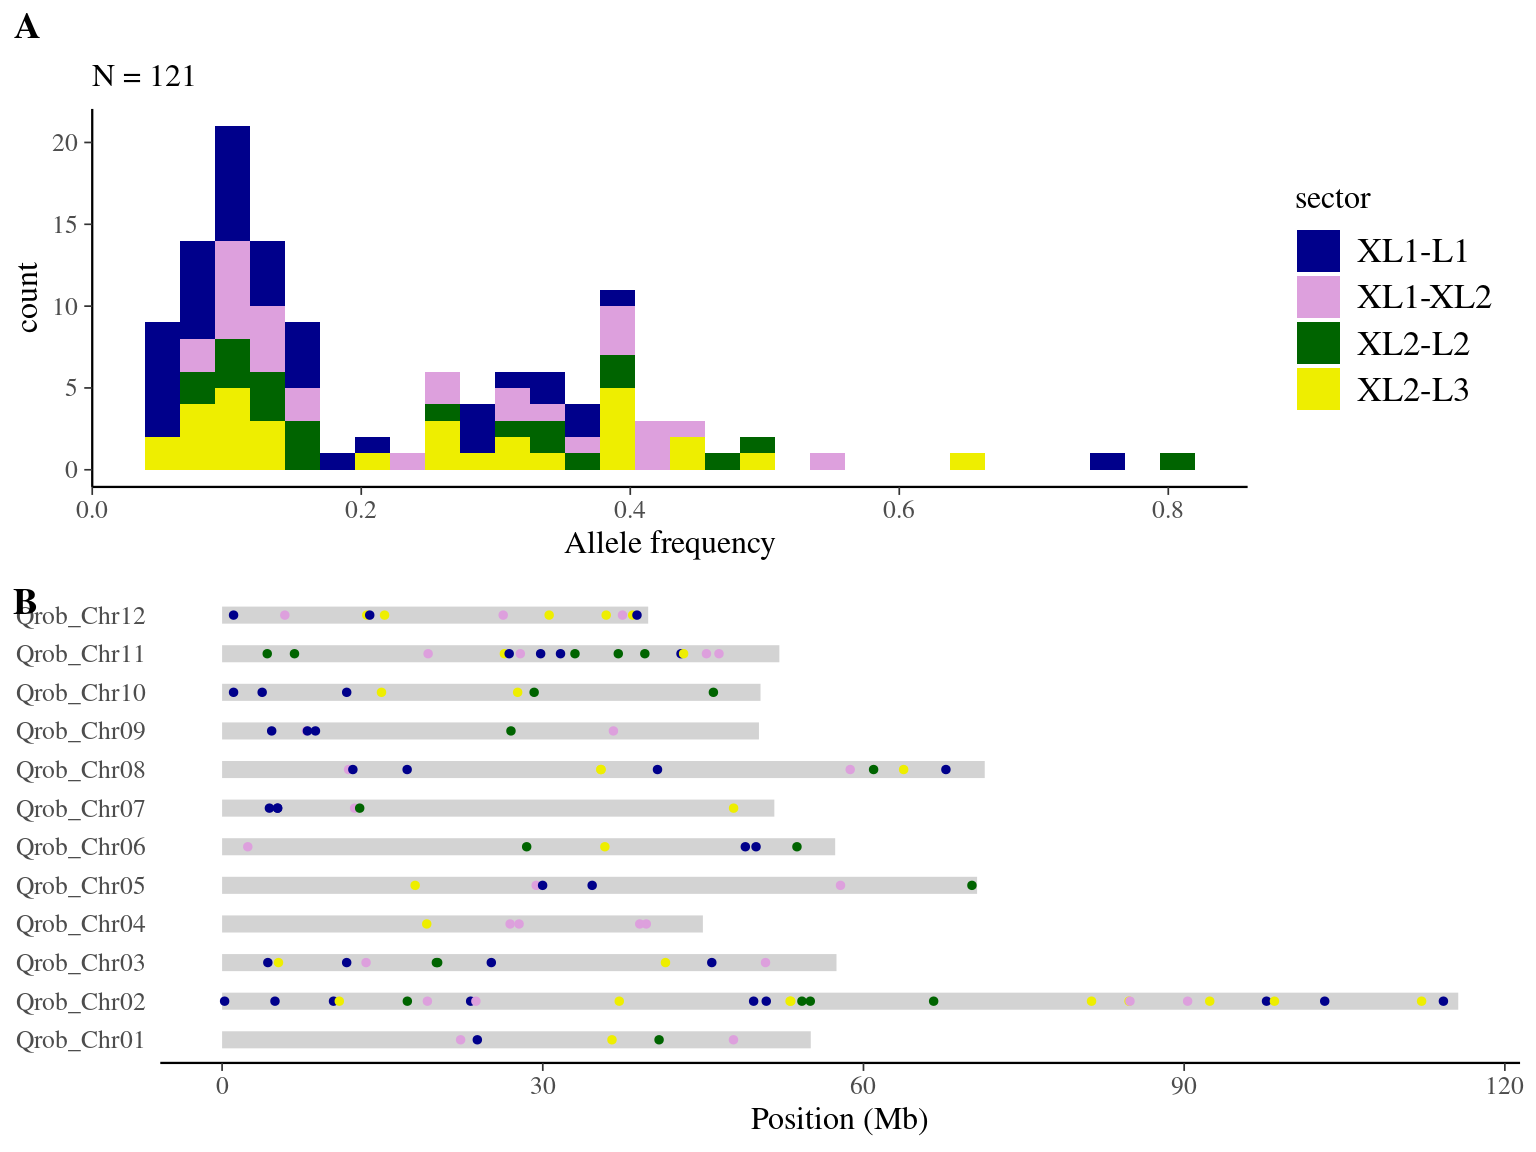
Figure 9.3: Mutations retained after original filtering: allele frequency (A) and positions on the 3P genome (B).
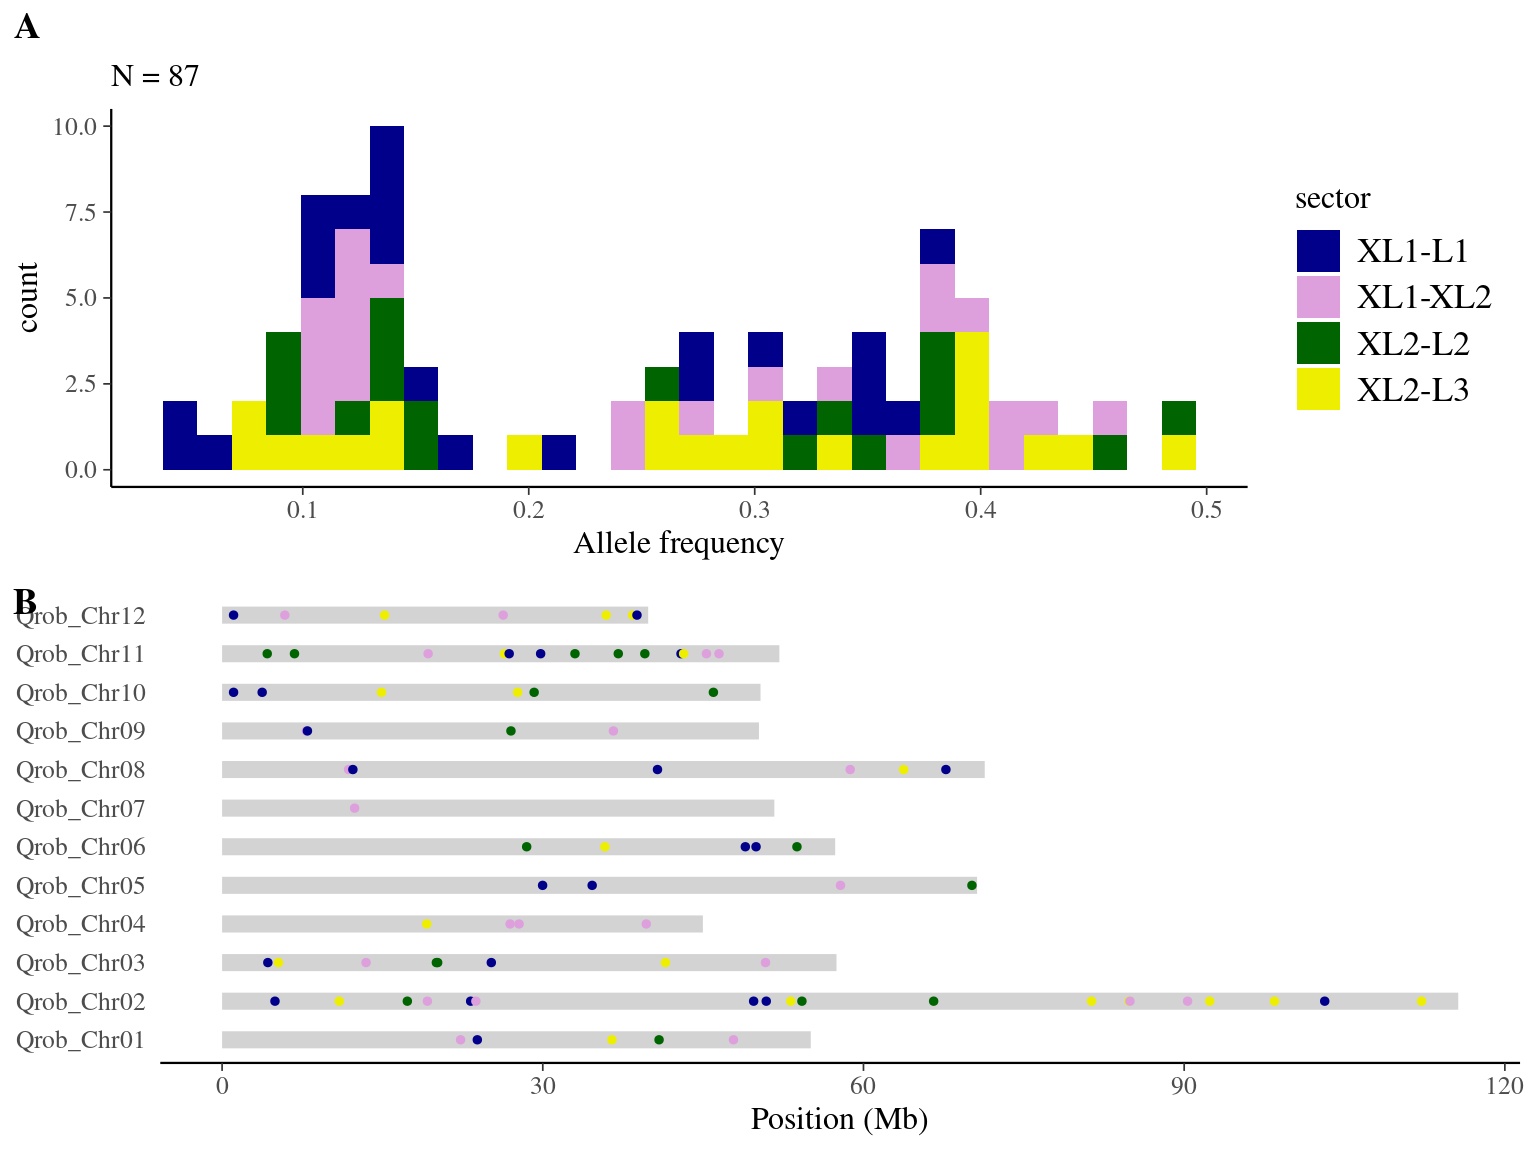
Figure 9.4: Mutations retained after robust filtering: allele frequency (A) and positions on the 3P genome (B).
9.4 Mutect2
Mutect2 produced 4.6 millions of candidate mutations with unique position across the 3 branches.
9.4.1 Overlap with original mutations
We tried to find back original mutations to have a look to their metrics.
We found back 57 out of the 60 expected mutations (95%) (Tab. 9.3.
which are exactly interestingly the same as Strelka2.
| Chromosome | Position | Mutated | Normal | Ref | Alt | Mutated AltCount | Mutated RefCount | Normal AltCount | Normal RefCount | Allelic fraction |
|---|---|---|---|---|---|---|---|---|---|---|
| Qrob_Chr08 | 58757092 | L2 | L1 | G | A | 35 | 55 | 0 | 113 | 0.3888889 |
| Qrob_Chr08 | 58757092 | L3 | L1 | G | A | 39 | 61 | 0 | 113 | 0.3900000 |
| Qrob_H2.3_Sc0000573 | 185294 | L2 | L1 | A | T | 15 | 52 | 0 | 84 | 0.2238806 |
| Qrob_H2.3_Sc0000573 | 185294 | L3 | L1 | A | T | 19 | 56 | 0 | 84 | 0.2533333 |
| Qrob_Chr03 | 13766652 | L2 | L1 | G | A | 43 | 5 | 0 | 77 | 0.8958333 |
| Qrob_Chr03 | 13766652 | L3 | L1 | G | A | 35 | 16 | 0 | 77 | 0.6862745 |
9.4.2 Filtering
We filtered mutations with the original filter, adjusting the coverage to preliminary low coverage obtained:
Original:
- A read depth for the two sample between half and two times the mean coverage (
normal_DP <= 320, normal_DP >= 80, mutation_DP <= 320, mutation_DP >= 80) - A null number of alternate allele count in the normal sample (
normal_altCount == 0) - A minimum of 10 alternate allele count in the mutated sample (
mutation_altCount >= 10) - An allelic frequency inferior to 0.5 (
tumor_AF <= 0.5) - A coherent temporal pattern (“XL1-XL2”, “XL2-L3”, “XL1-L1”, “XL2-L2”)
We obtained 948 candidates (Fig 9.5) for the original filter.
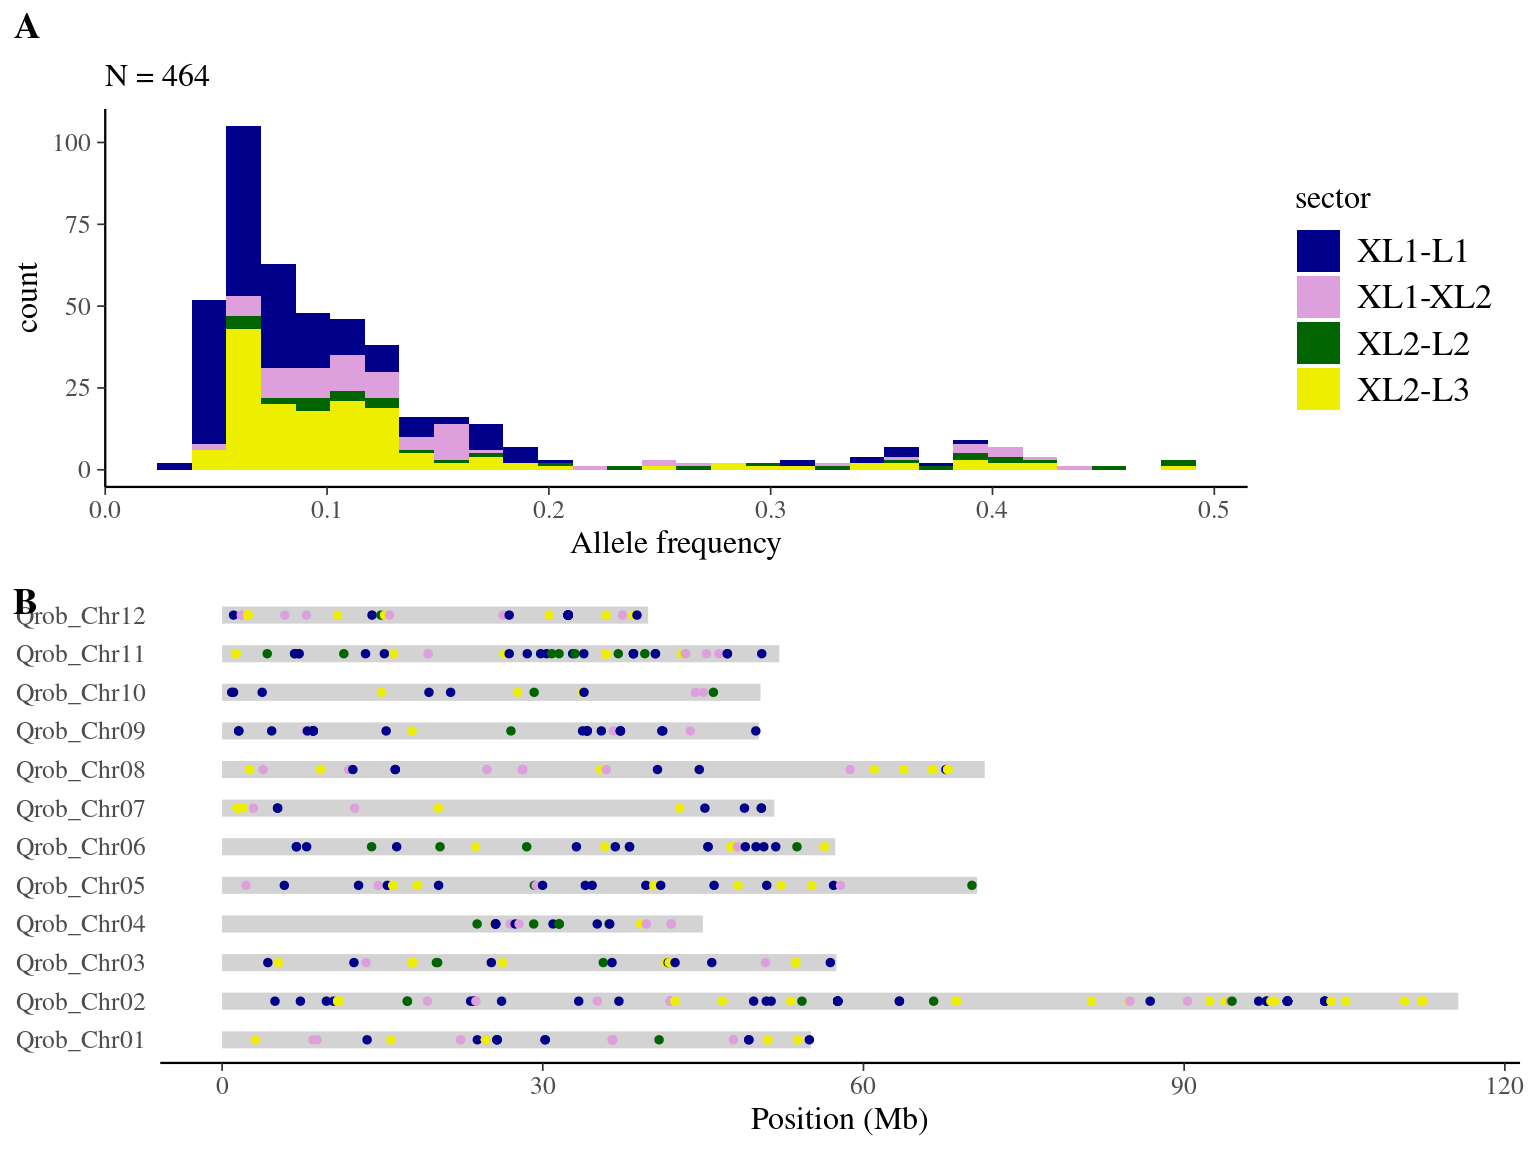
Figure 9.5: Mutations retained after original filtering: allele frequency (A) and positions on the 3P genome (B).