Chapter 8 Mutations Swiss
This chapter describes the reanalyses of data from Schmid-Siegert et al. (2017) currently done in the swiss branch of the detectMutations repository.
8.1 Mutations from Schmid-Siegert on 3P
I reported the mutations (Tab. 8.1) from the supplementary table 2 from Schmid-Siegert et al. (2017), and aligned them back on the 3P genome (Fig. 8.1). I found back only 14 of the original 17 mutations from Napoleon
| Mutation | CHROM | POS | tumor | REF | ALT |
|---|---|---|---|---|---|
| SNV1 | Qrob_H2.3_Sc0000161 | 602274 | Upper | T | C |
| SNV2 | Qrob_Chr09 | 2166134 | Upper | C | T |
| SNV3 | Qrob_Chr05 | 56685984 | Upper | C | T |
| SNV4 | Qrob_Chr05 | 25205243 | Upper | C | T |
| SNV5 | Qrob_Chr05 | 44871901 | Upper | C | T |
| SNV6 | Qrob_Chr01 | 39504822 | Upper | T | A |
| SNV7 | Qrob_H2.3_Sc0000061 | 381637 | Upper | C | T |
| SNV8 | Qrob_Chr04 | 37893394 | Upper | G | A |
| SNV9 | Qrob_H2.3_Sc0000504 | 516352 | Upper | T | A |
| SNV10 | Qrob_Chr04 | 36278589 | Upper | C | T |
| SNV13 | Qrob_Chr08 | 54574817 | Lower | G | A |
| SNV14 | Qrob_Chr09 | 30863836 | Lower | G | A |
| SNV16 | Qrob_Chr05 | 9535260 | Lower | T | C |
| SNV17 | Qrob_Chr07 | 215451 | Lower | G | A |
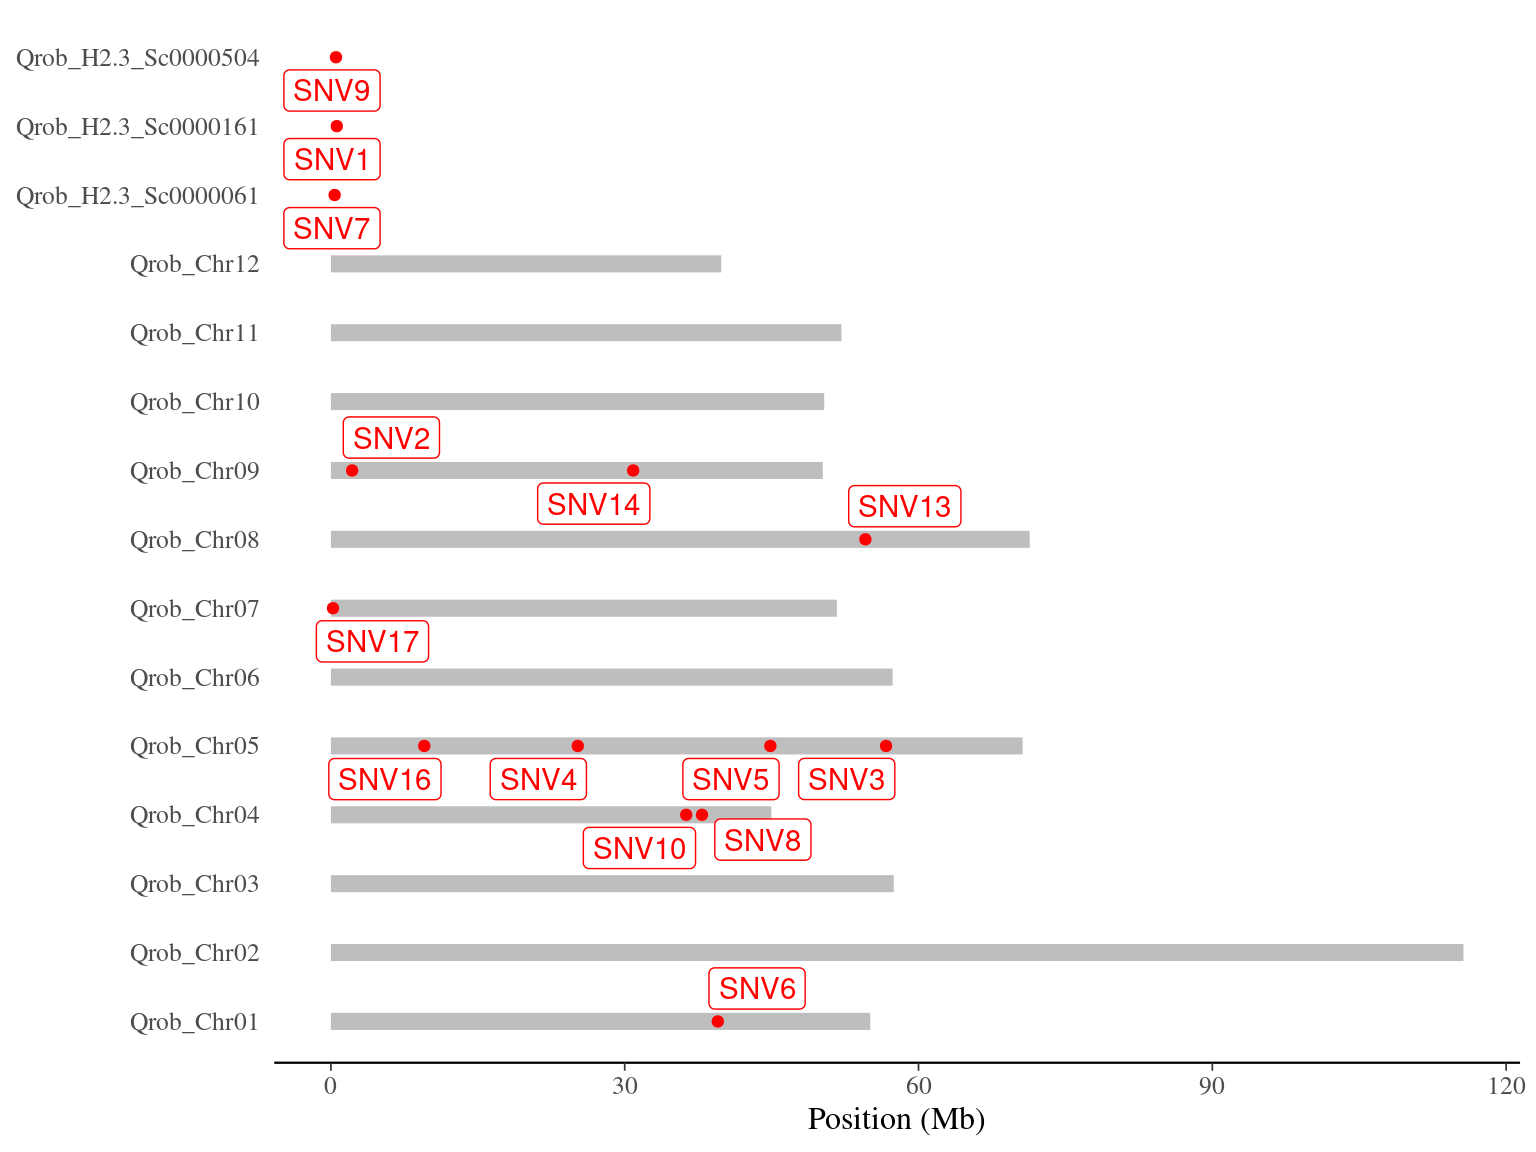
Figure 8.1: Napoleon’s original mutations on the 3P genome.
8.2 Strelka2
Strelka2 produced 4.2 millions of candidate mutations.
8.2.1 Overlap with mutations from Schmid-Siegert
I tried to find back Napoleon’s original mutations to have a look to their metrics.
I found back only 12 out of the 14 expected mutations (86%) (Tab. 8.2 and Fig. 8.2).
Beware, Strelka2 is detecting putative mutations in the normal sample !
I looked at different metrics for each (Fig. 8.3):
mutation_DPandnormal_DPare the read depth for the two sample, and shows as expected values between half and two times the mean coverage (60X)normal_altCountT1is the number of alternate allele count in the normal sample, should be 0, but is equal to 3 and 4 (9% of reads) for two SNVsmutation_altCountT1is the number of alternate allele count in the mutated sample, should be not too low, and is most the time above 5
The main conclusion is that the mutations detected by Schmid-Siegert et al. (2017) have not always no reads in the “normal” sample and that they show a wide variation of allelic frequency.
| Mutation | Mutated | Normal | Ref | Alt | Mutated AltCount | Mutated RefCount | Normal AltCount | Normal RefCount | Allelic fraction |
|---|---|---|---|---|---|---|---|---|---|
| SNV1 | upper | lower | T | C | 0 | 71 | 14 | 42 | 0.0000000 |
| SNV1 | lower | upper | T | C | 14 | 43 | 0 | 71 | 0.2500000 |
| SNV2 | upper | lower | C | T | 0 | 90 | 25 | 70 | 0.0000000 |
| SNV2 | lower | upper | C | T | 25 | 70 | 0 | 90 | 0.2631579 |
| SNV3 | upper | lower | G | A | 0 | 62 | 11 | 39 | 0.0000000 |
| SNV3 | lower | upper | G | A | 11 | 39 | 0 | 62 | 0.2200000 |
| SNV4 | upper | lower | C | T | 0 | 60 | 16 | 48 | 0.0000000 |
| SNV4 | lower | upper | C | T | 16 | 49 | 0 | 59 | 0.2500000 |
| SNV5 | upper | lower | C | T | 0 | 70 | 13 | 33 | 0.0000000 |
| SNV5 | lower | upper | C | T | 13 | 39 | 0 | 63 | 0.2826087 |
| SNV6 | upper | lower | A | T | 0 | 65 | 14 | 41 | 0.0000000 |
| SNV6 | lower | upper | A | T | 14 | 48 | 0 | 62 | 0.2545455 |
| SNV8 | upper | lower | G | A | 0 | 52 | 12 | 32 | 0.0000000 |
| SNV8 | lower | upper | G | A | 12 | 34 | 0 | 52 | 0.2727273 |
| SNV9 | upper | lower | T | A | 0 | 76 | 16 | 26 | 0.0000000 |
| SNV9 | lower | upper | T | A | 20 | 34 | 0 | 63 | 0.3809524 |
| SNV10 | upper | lower | C | T | 0 | 72 | 10 | 30 | 0.0000000 |
| SNV10 | lower | upper | C | T | 10 | 31 | 0 | 71 | 0.2500000 |
| SNV13 | upper | lower | C | T | 19 | 31 | 3 | 33 | 0.3958333 |
| SNV13 | lower | upper | C | T | 3 | 35 | 19 | 29 | 0.0833333 |
| SNV16 | upper | lower | T | C | 10 | 70 | 4 | 42 | 0.1694915 |
| SNV17 | upper | lower | G | A | 25 | 51 | 4 | 55 | 0.3287671 |
| SNV17 | lower | upper | G | A | 4 | 57 | 24 | 49 | 0.0677966 |
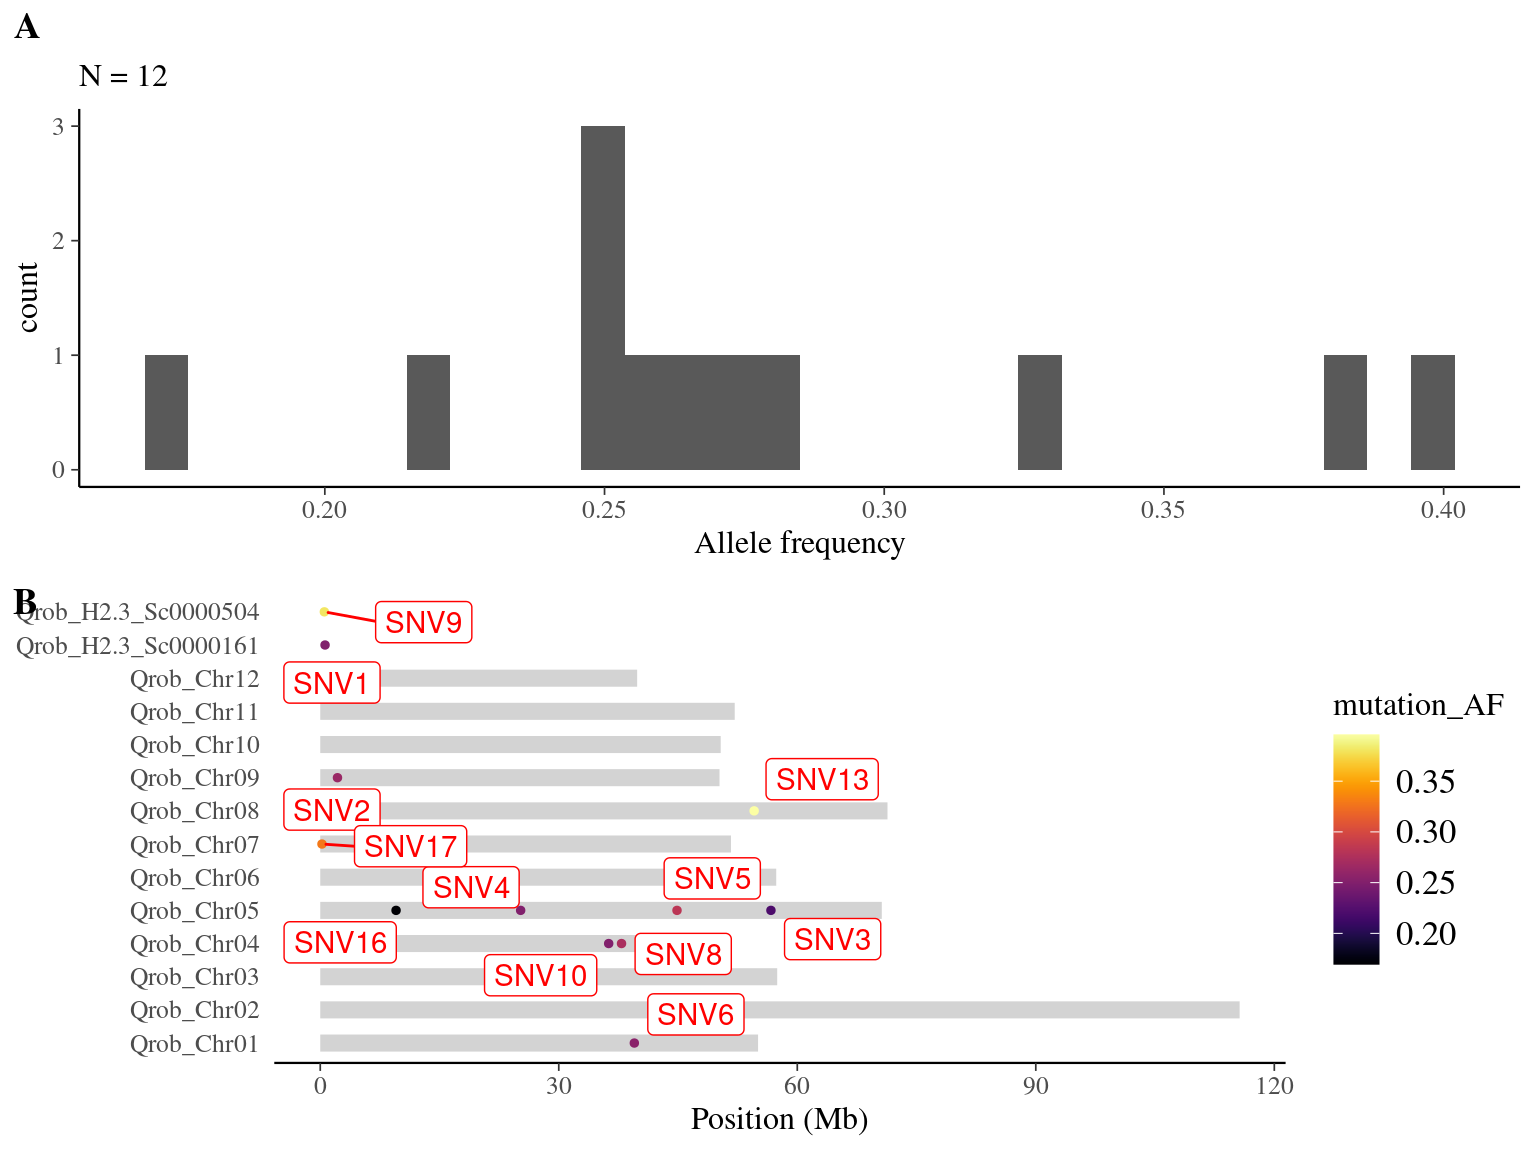
Figure 8.2: Overlap between candidate mutations and Napoleon’s original mutations: allele frequency (A) and positions on the 3P genome (B).
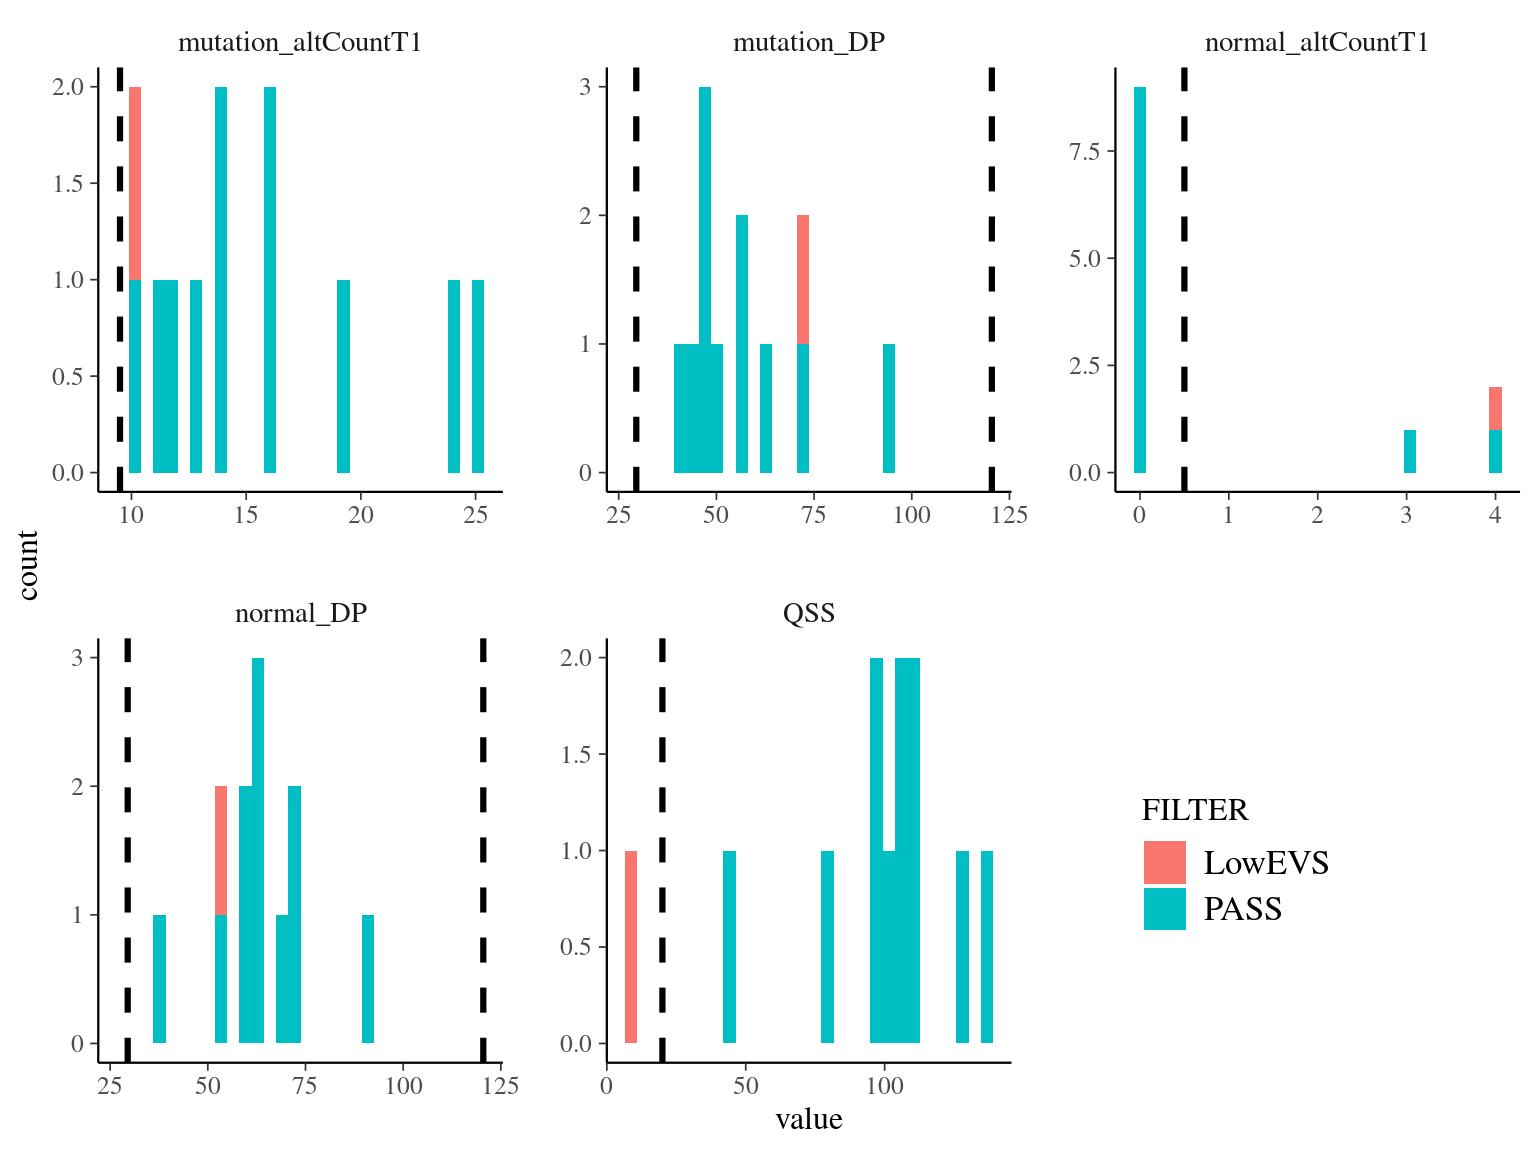
Figure 8.3: Evaluation of the overlap between candidate mutations and Napoleon’s original mutations.
8.2.2 Filtering
We filtered mutations with following filters:
- A read depth for the two sample between half and two times the mean coverage (
normal_DP <= 120, normal_DP >= 30, mutation_DP <= 120, mutation_DP >= 30) - A null number of alternate allele count in the normal sample (
normal_altCount == 0) - A minimum of 10 alternate allele count in the mutated sample (
mutation_altCount >= 10)
We obtained 223 candidates (Fig 8.4).
We then used the suggested automatic filter of Strelka2,
resulting in a robust dataset of 87 mutations (Fig 8.5).
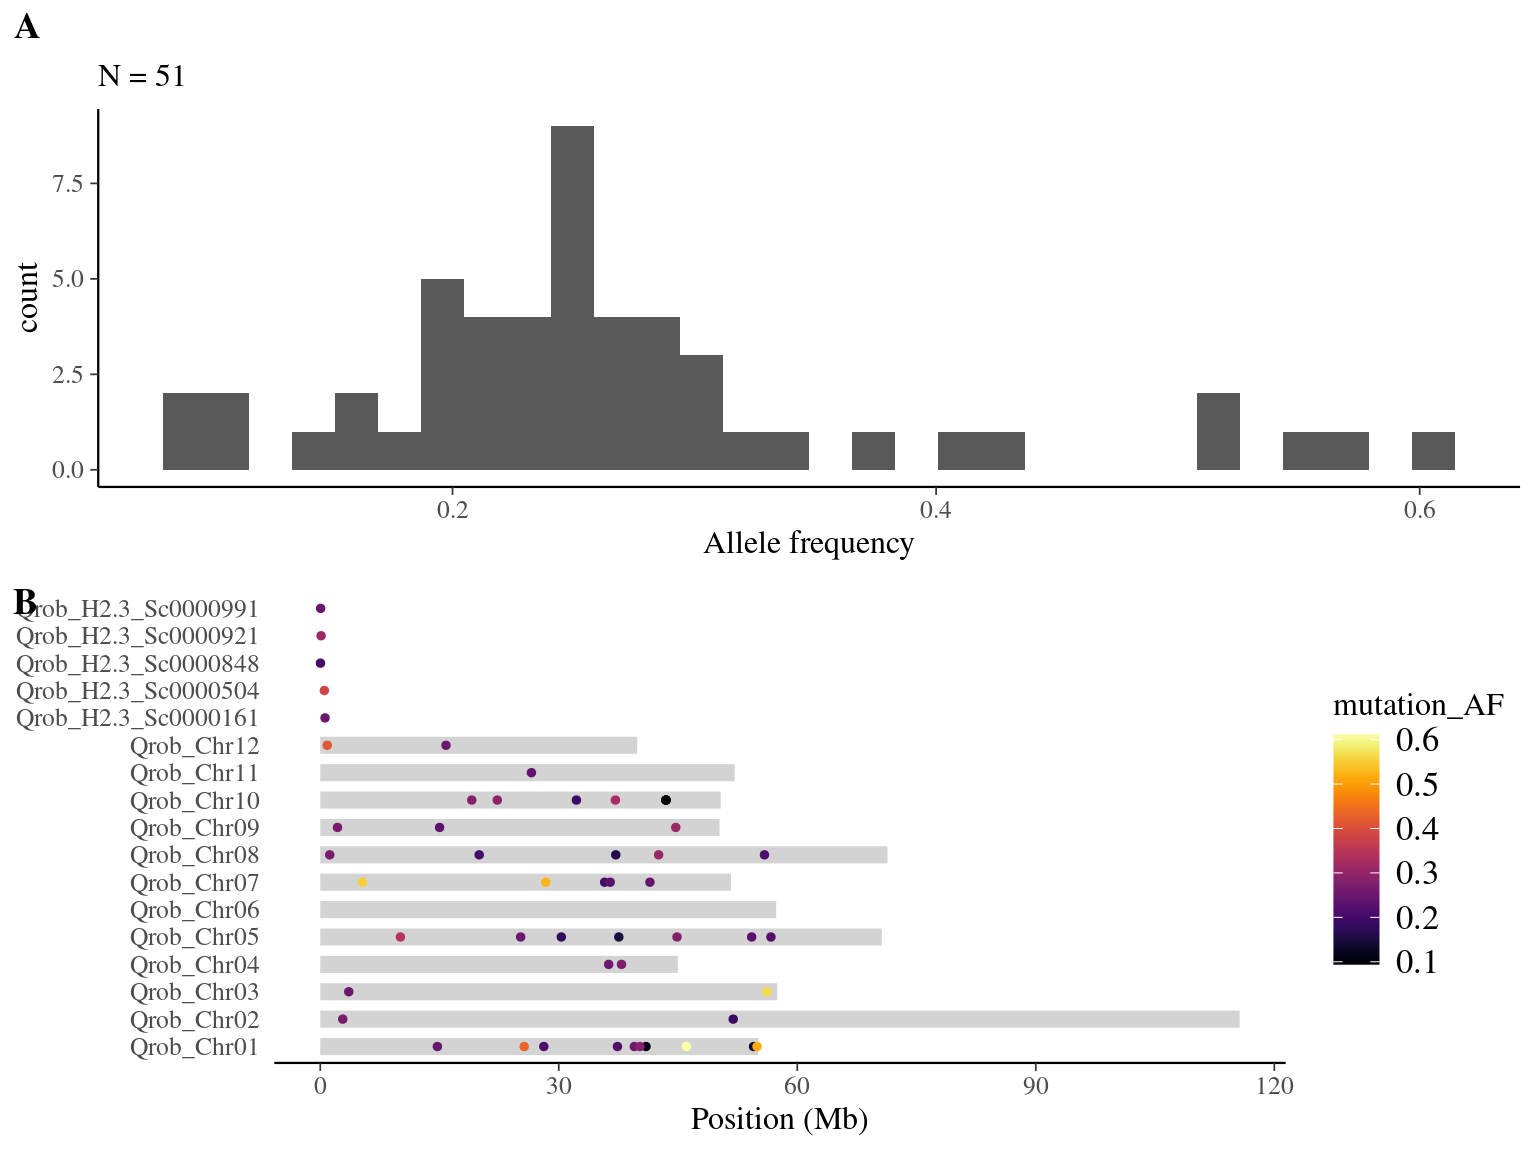
Figure 8.4: Mutations retained after original filtering: allele frequency (A) and positions on the 3P genome (B).
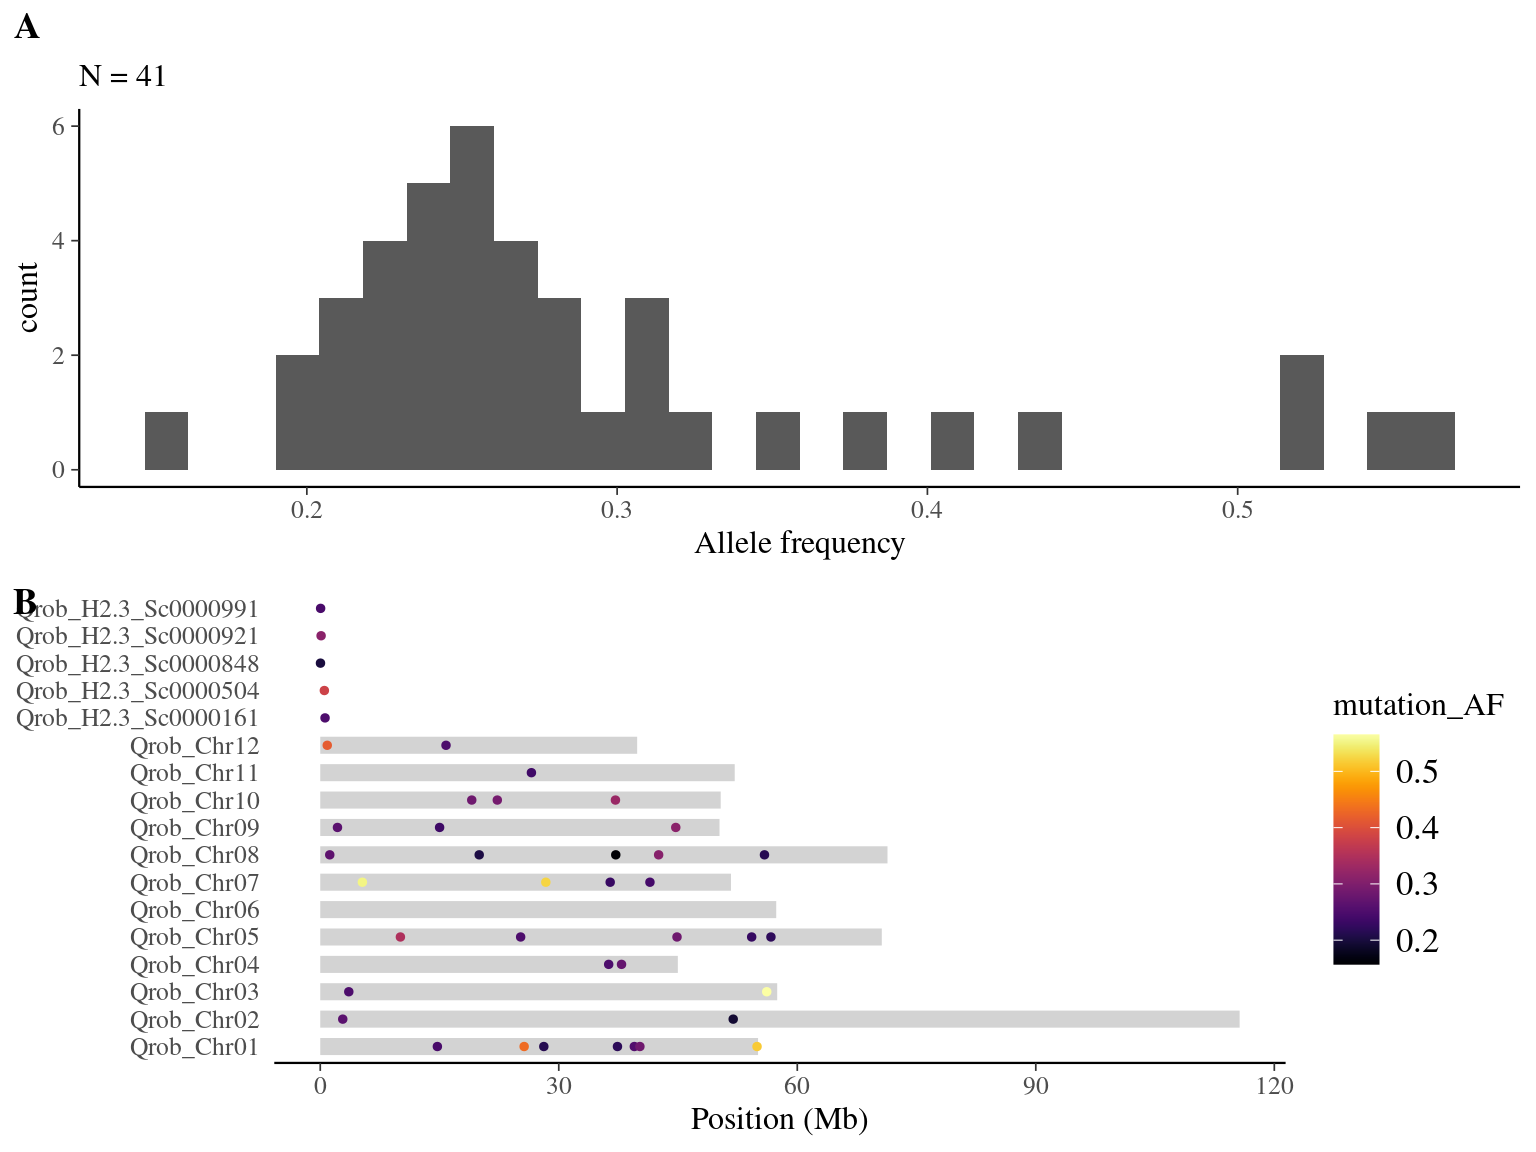
Figure 8.5: Mutations retained after robust filtering: allele frequency (A) and positions on the 3P genome (B).
8.3 GATK
GATK produced 11.1 millions of candidates!
8.3.1 Overlap with mutations from Schmid-Siegert
I tried to find back Napoleon’s original mutations to have a look to their metrics. I found back only 12 out of the 14 expected mutations (86%) (Tab. 8.3 and Fig. 8.6). I looked at different metrics for each (Fig. 8.3):
mutation_DPandnormal_DPare the read depth for the two sample, and shows as expected values between half and two times the mean coverage (60X)normal_altCountT1is the number of alternate allele count in the normal sample, should be and is 0mutation_altCountT1is the number of alternate allele count in the mutated sample, should be not too low, and is most the time above 10
The main conclusion is that the mutations detected by Schmid-Siegert et al. (2017) have no reads in the “normal” sample using GATK with hard filtering which probably already removed low-DP copies in the normal sample, while Strelka2 detect them.
| Mutation | Mutated | Normal | Mutated AltCount | Mutated RefCount | Normal AltCount | Normal RefCount | Allelic fraction |
|---|---|---|---|---|---|---|---|
| SNV1 | lower | upper | 15 | 41 | 0 | NA | 0.2678571 |
| SNV2 | lower | upper | 25 | 70 | 0 | NA | 0.2631579 |
| SNV3 | lower | upper | 10 | 39 | 0 | NA | 0.2040816 |
| SNV4 | lower | upper | 15 | 49 | 0 | NA | 0.2343750 |
| SNV5 | lower | upper | 13 | 31 | 0 | NA | 0.2954545 |
| SNV6 | lower | upper | 13 | 45 | 0 | NA | 0.2241379 |
| SNV8 | lower | upper | 12 | 34 | 0 | NA | 0.2608696 |
| SNV9 | lower | upper | 17 | 24 | 0 | NA | 0.4146341 |
| SNV10 | lower | upper | 10 | 30 | 0 | NA | 0.2500000 |
| SNV13 | upper | lower | 19 | 29 | 0 | NA | 0.3958333 |
| SNV16 | upper | lower | 10 | 49 | 0 | NA | 0.1694915 |
| SNV17 | upper | lower | 25 | 51 | 0 | NA | 0.3289474 |
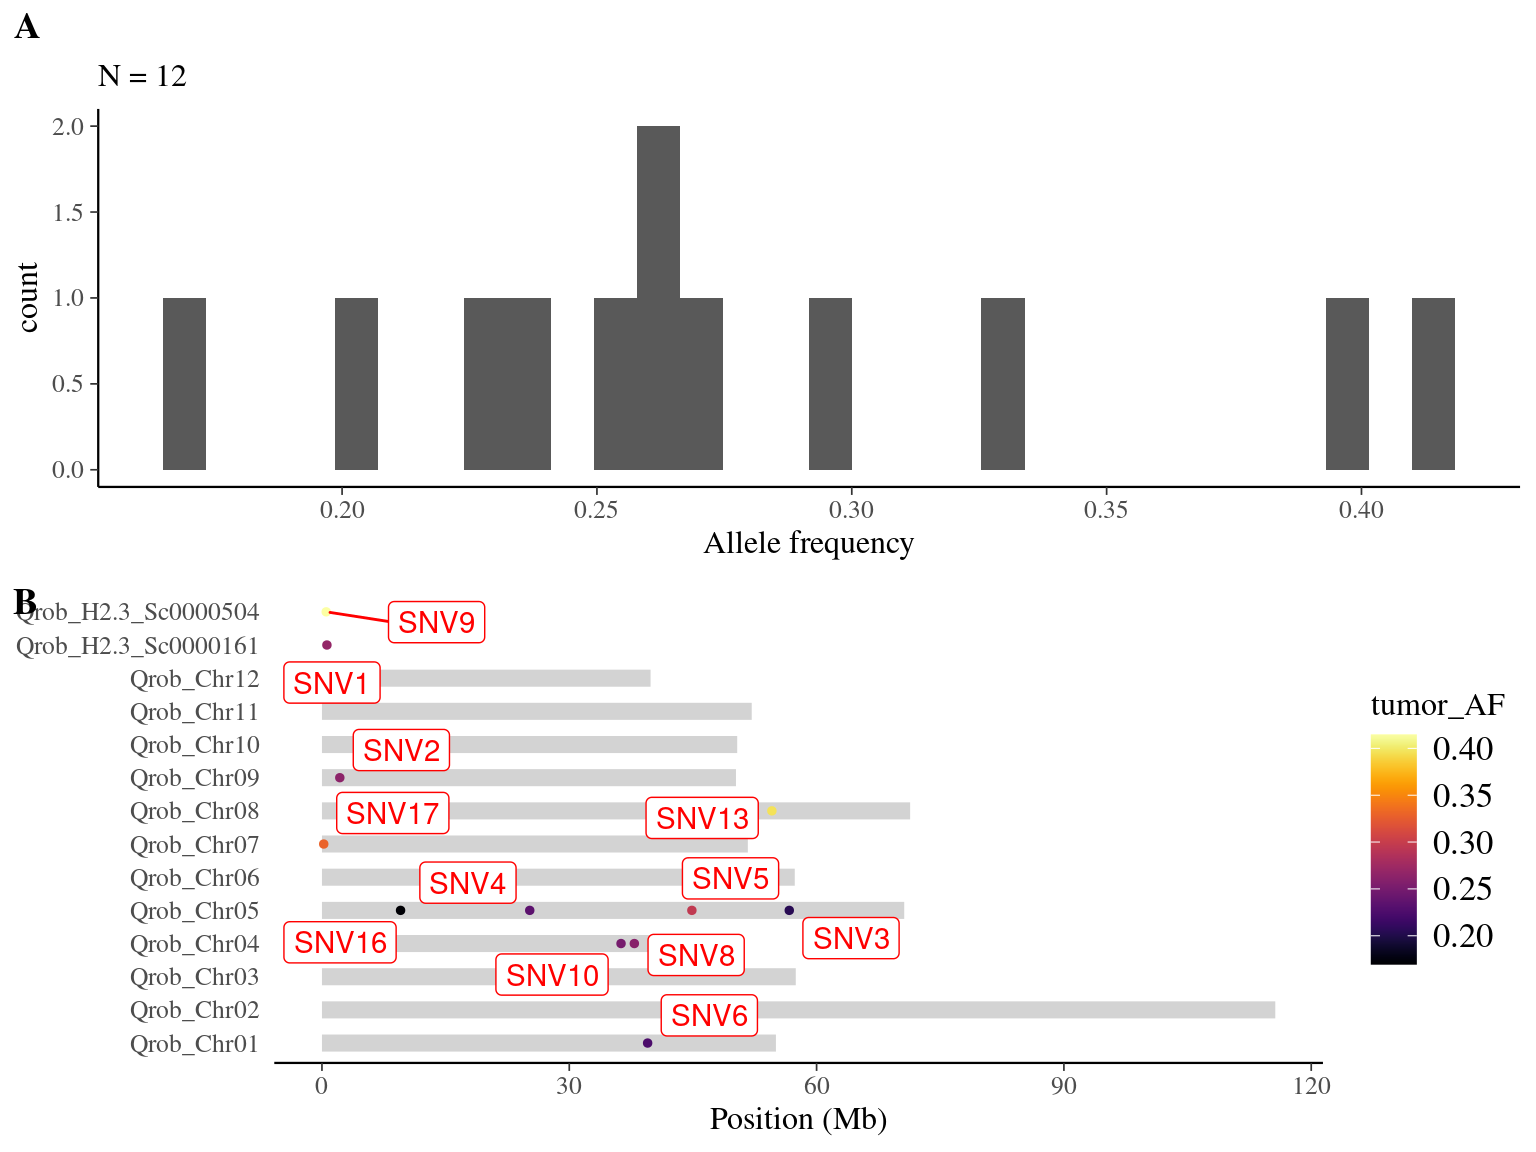
Figure 8.6: Overlap between candidate mutations and Napoleon’s original mutations: allele frequency (A) and positions on the 3P genome (B).
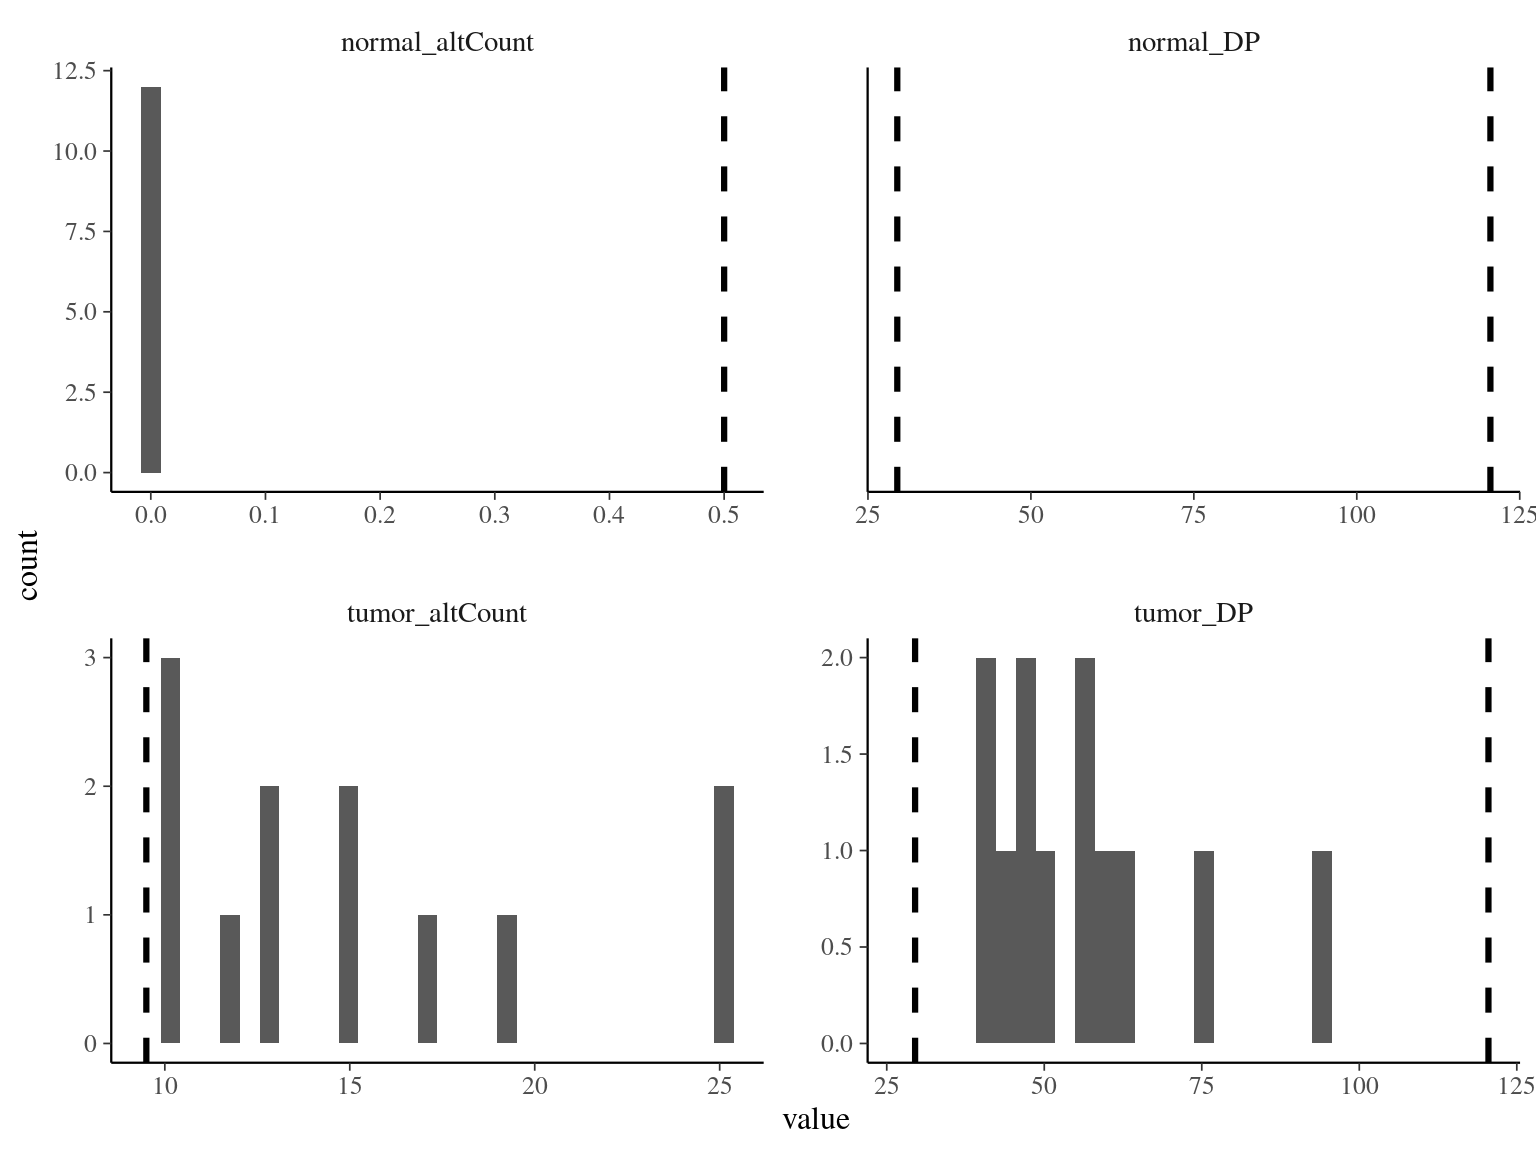
Figure 8.7: Evaluation of the overlap between candidate mutations and Napoleon’s original mutations.
8.3.2 Filtering
We filtered mutations with following filters:
- A read depth for the tumor sample between half and two times the mean coverage (
tumor_DP <= 120, tumor_DP >= 30) - A null number of alternate allele count in the normal sample (
normal_altCount == 0) - A minimum of 10 alternate allele count in the mutated sample (
tumor_altCount >= 10) - An allelic frequency inferior to 0.5 (
tumor_AF <= 0.5)
We obtained 510 611 candidates (Fig 8.8).
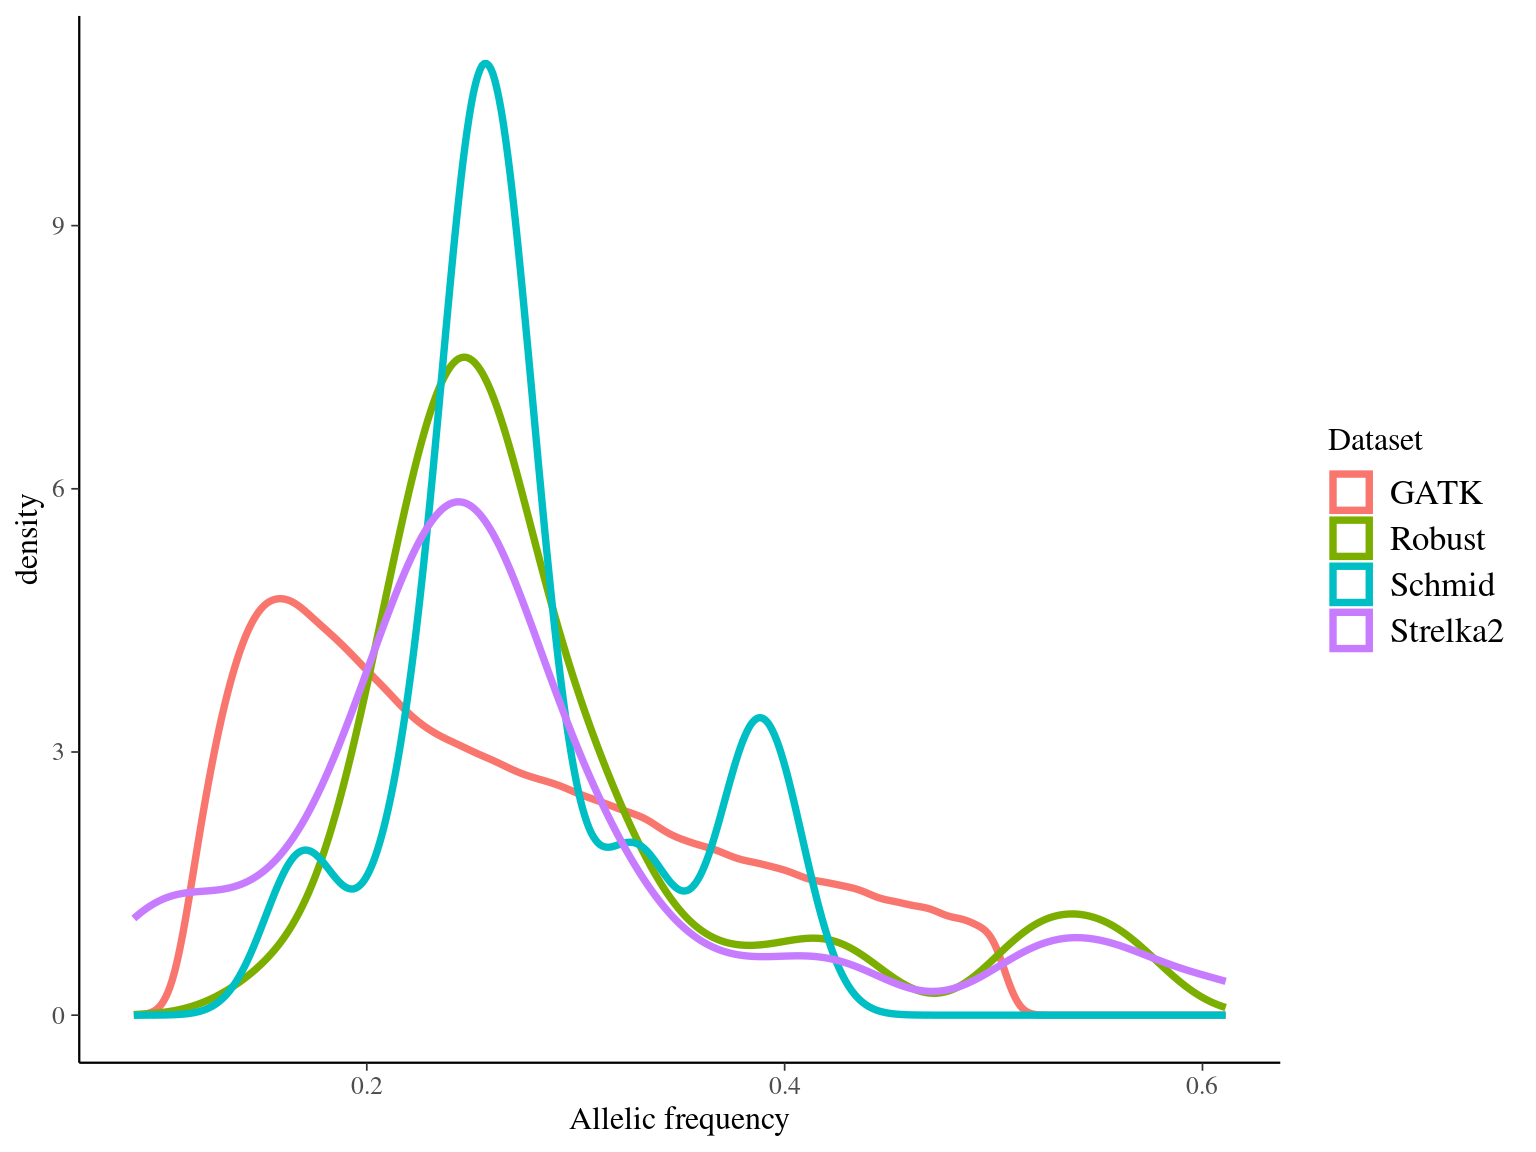
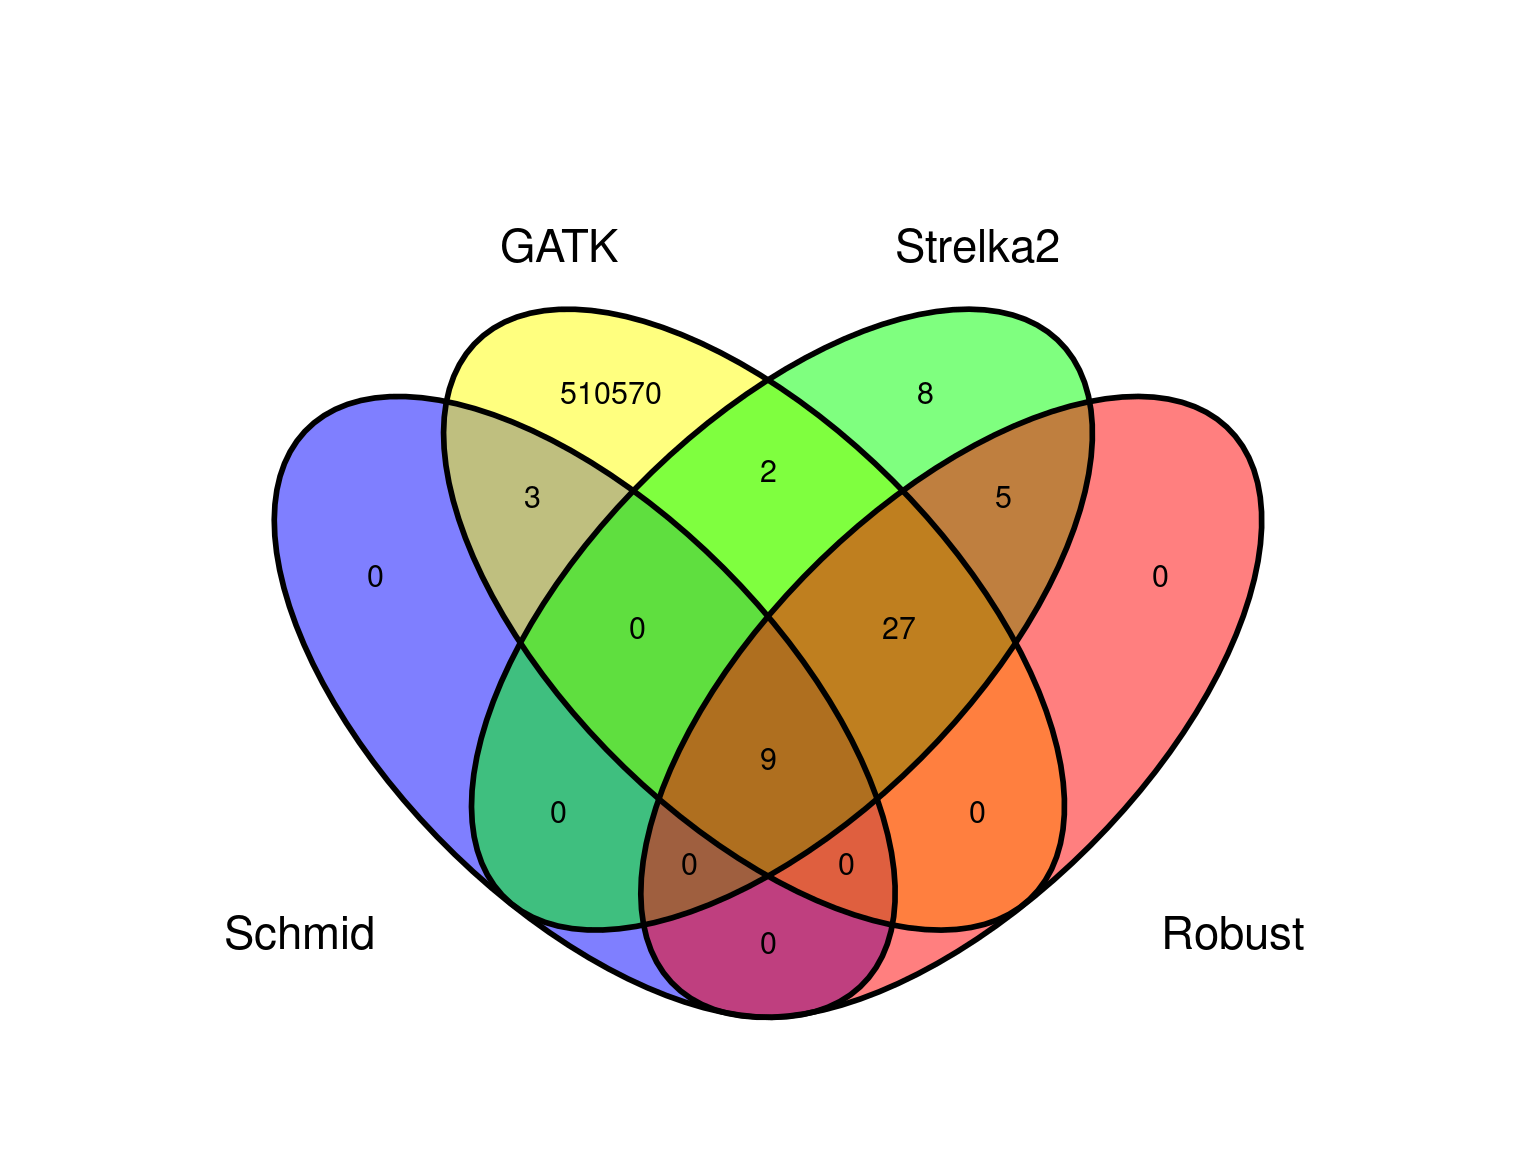
We then looked for the overlap between GATK candidates and the suggested automatic filter of Strelka2,
resulting in a robust dataset of 47 mutations (Fig 8.9).
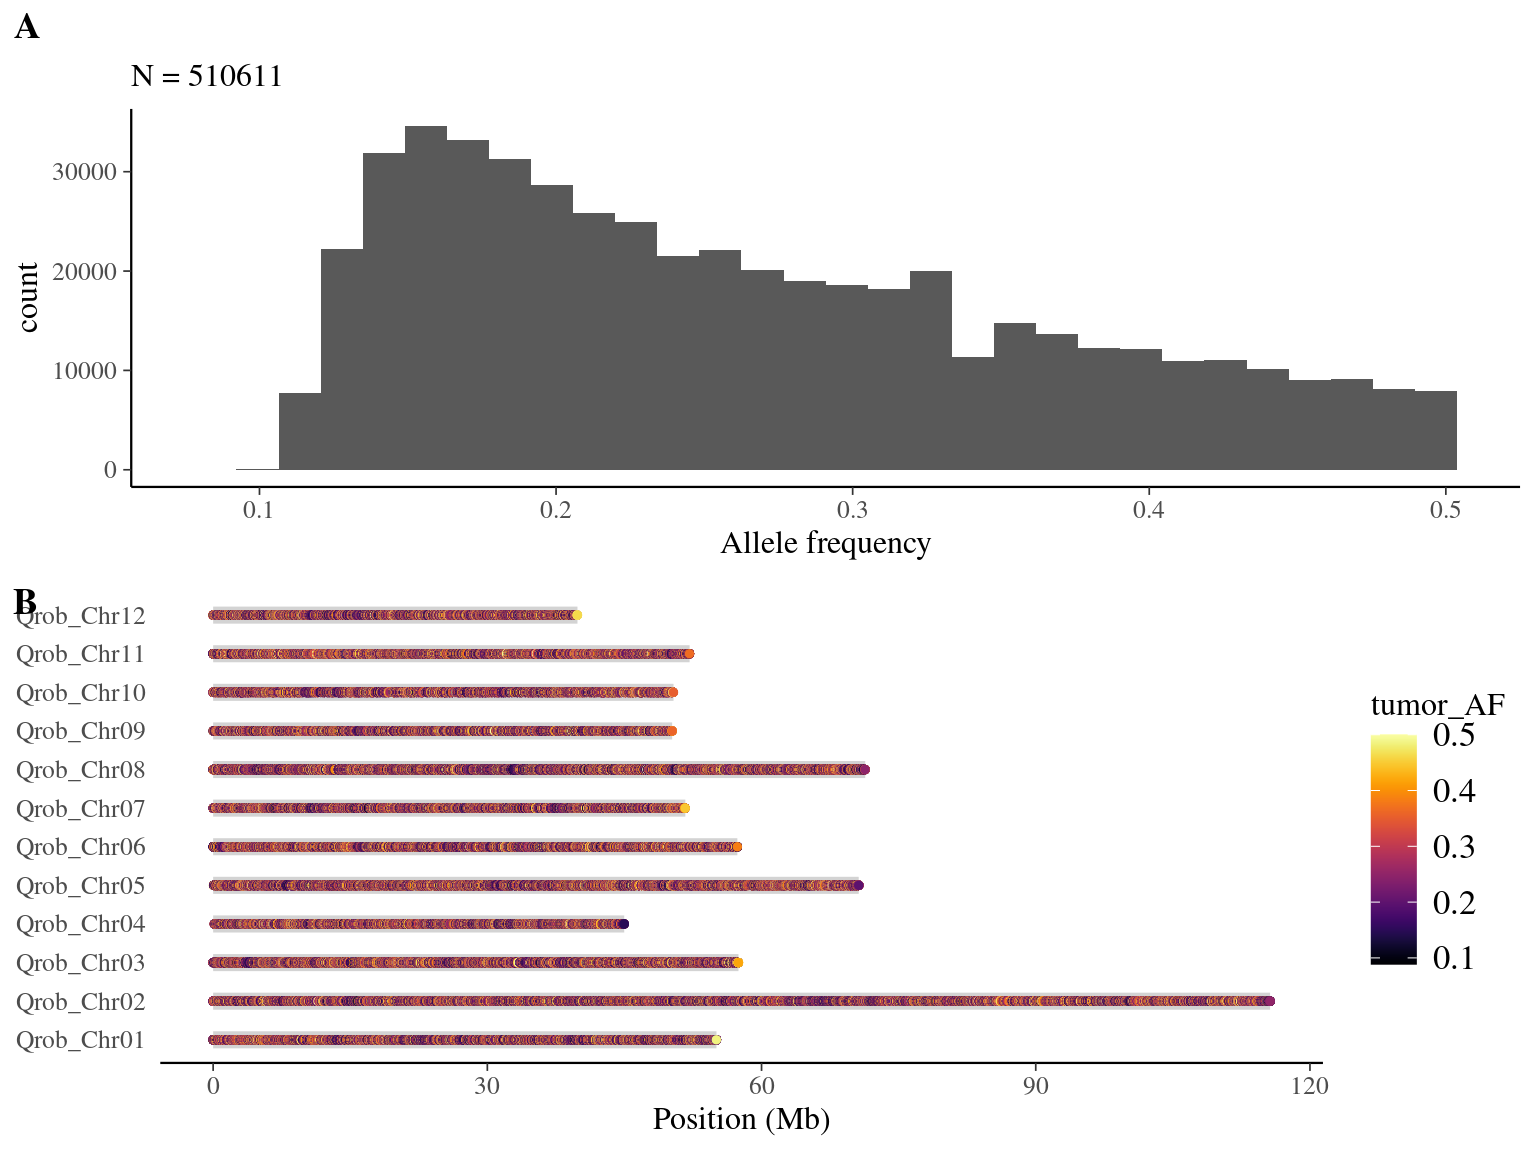
Figure 8.8: Mutations retained after original filtering: allele frequency (A) and positions on the 3P genome (B).
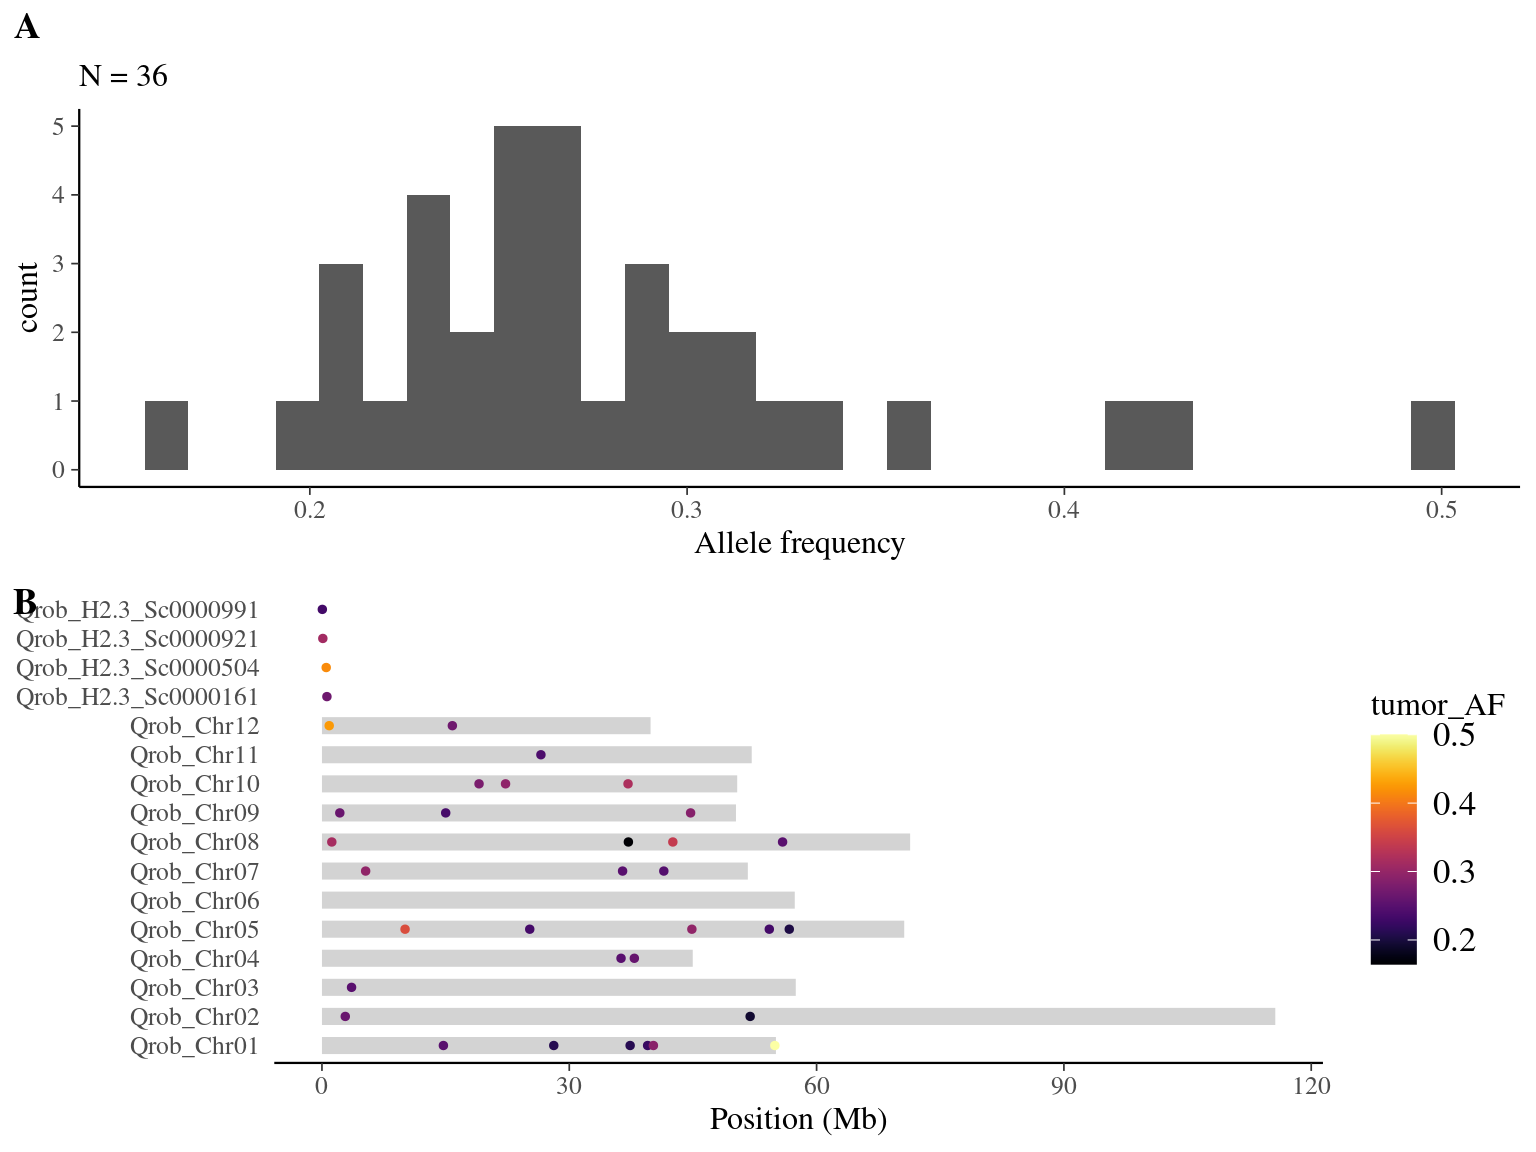
Figure 8.9: Mutations retained after robust filtering: allele frequency (A) and positions on the 3P genome (B).